Quick Summary Settings
The Quick Summary panel in the Element Details panel, provides a graphical view of Attributes of an element template for which you are most interested in reviewing. The Attributes you select are displayed in a chart format, which is also configurable as to the type of chart used, and the colors that represent each Attribute in the chart.
The Quick Summary panel allows also to show calculated on the fly values that you can configure by the Quick Summary Settings.
To set or change the Quick Summary settings:
Ensure that you have clicked on a Template for which to define the Quick Summary layout.
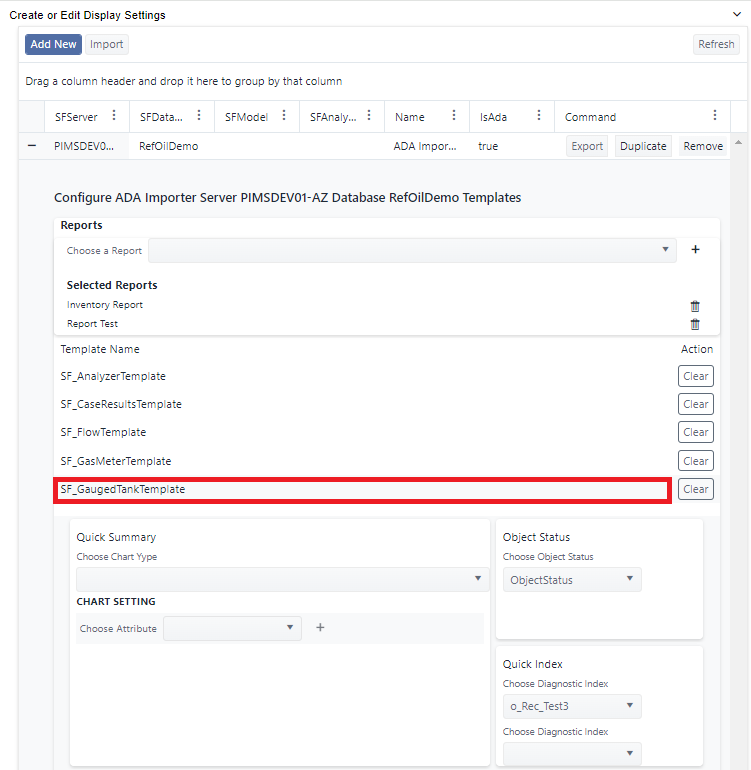
Add or modify the settings for the selected template
See the below sections about to:
When finished, you can click on another template to configure.
Your configurations are automatically saved as soon as you make a change.
Quick Summary Chart
Add or change the Quick Summary Chart
To add or change the Quick Summary Chart:
Quick Summary - Add
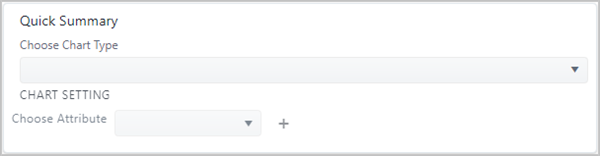
In the Quick Summary panel, click the Choose Chart Type down-arrow to display the list of available charts.
- Pie
- Gauge
- Line
- Bar
- List "On The Fly Calculation" - see Add / Remove an On the Fly Calculation Quick Summary List for further details on this chart option.
Pick the Quick Summary chart you want to use.
In our example, we have selected the "Pie" chart, as shown in the following figure.
Quick Summary - Pie chart - Choose Attribute
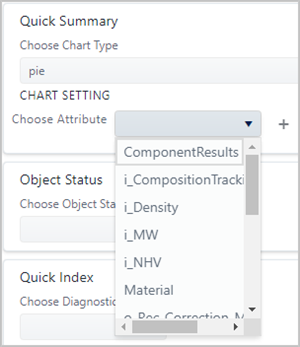
Click the Choose Attribute down-arrow, and select an Attribute that you want displayed in the chart.
Click the
 add button to add the Attribute to the chart.
(Optional) To change the color that represents an Attribute in the chart:
a. Click on the current color circle, as shown in the following figure.
Color Selection panel
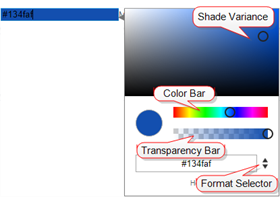
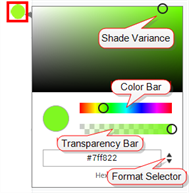
b. To change the shade of the current color, drag the Shade Variance circle to around the display until you reach the shade you want.
c. To change the color itself, drag the Color Bar circle across the bar until you reach the color you want.
d. To change the transparency of the color, drag the Transparency Bar circle along the bar until you reach the transparency you want to use.
e. If you prefer to enter a color setting in Hexadecimal, RGB or HSLA format, use the Format Selector to select the format, and then enter the applicable color code(s).
f. When finished, click outside the panel to close it.
Repeat steps 2 through 5 for each Attribute you want to add to the graph.
Remove a Quick Summary Chart
To remove an Attribute from the Quick Summary Graph:
1 .In the List of Attributes, click on the ![]() trash can icon of the Attribute you want to remove.
trash can icon of the Attribute you want to remove.
The Attribute is immediately removed from the list that are included in the graph.
Quick Summary Chart example
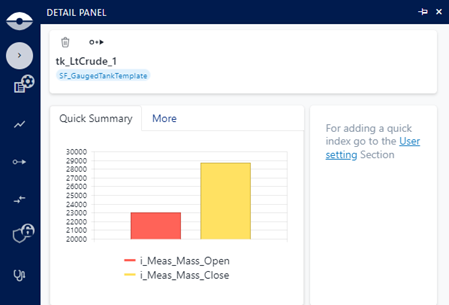
In this example, the Quick Summary has been configured to show a bar chart where the i_Meas_Mass_Open and i_Meas_Mass_Close are plotted vertically.

The rendering in SFHub Visualizer - Element Details panel - will be the following:
On the Fly Calculation
The On the Fly Calculation (List) chart type allows you to configure a calculation on the fly, that is shown in the Quick Summary panel instead of a chart. This option allows you to easily extend the set of data for an element template, which makes it available to calculated values, according to the configured expression. The expression is any formula that uses arithmetical operators, combined with attributes or built-in functions, that are made available by the SFHub calculation engine (for more details, please refer related documentation).
Add an On the Fly Calculation Quick Summary List
To add an on the fly calculation:
Click the Quick Summary down-arrow to open the panel.
Quick Summary - Choose On The Fly Calculation or List
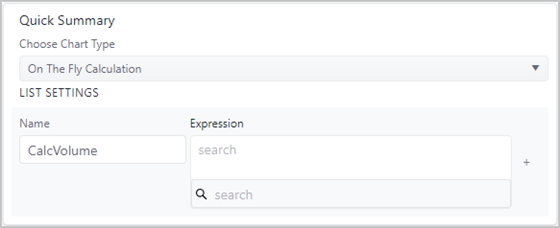
Click the Choose Chart Type down-arrow and select On The Fly Calculation (List in SFHub Admin).
In the Name box, type a name for the calculation.
In the Expression box, type the expression you want to use, or Click on Search to open the SFHub expression helper, which allows you to select from the available built-in functions, Special Keywords or Attributes to be referenced by the expression, as shown in the following figure.
Expression Helper panel
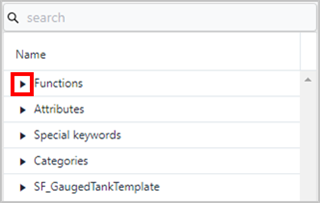
Click the arrow next to the helper you want to select from, to expand a list of the helpers.
Repeat step 5 for each helper you want to use.
When you are finished with the whole expression, click the + (add) icon to add it.
Remove an On the Fly Calculation Quick Summary List
To remove an existing On the Fly Calculation:
Click the Quick Summary down-arrow to open the panel.
Quick Summary - with On the Fly - with On the Fly Calculations
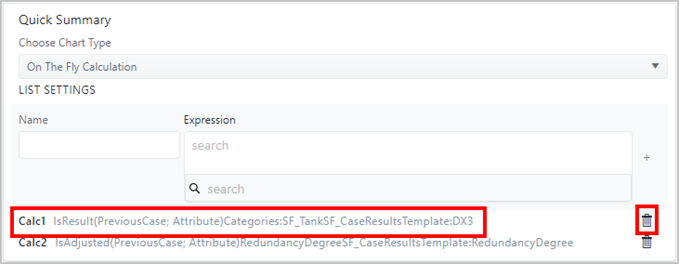
Locate the calculation expression you want to remove, and click its
 (delete) icon.
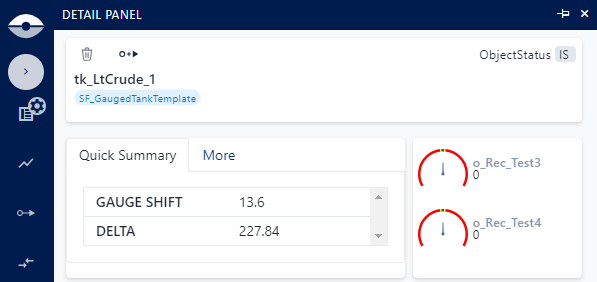
On the Fly Calculation examples
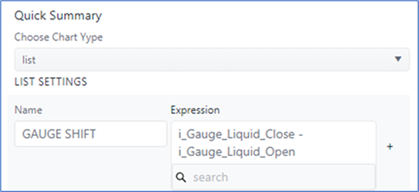
In this example two calculations have been configured:
A calculation named 'GAUGE SHIFT' where the expression calculates the difference between two attributes.
Calculation named GAUGE SHIFT
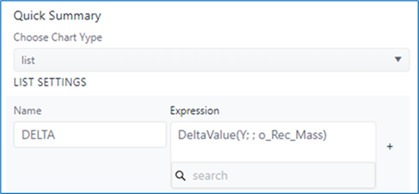
A calculation named 'DELTA' where the expression calculates the delta stock of the tank using the built-in function
DeltaValueapplied on theo_Rec_Massattribute.Calculation named DELTA
The rendering of this configuration on the Element Delails panel will be: