Attribute Settings
In SFHub Admin, the SFHubVisualizer® Settings panels include several settings that allow defining of settings at the Attribute level.
Create associations between custom assigned names for statistical test factors and the standard statistical test factors that SFHub Visualizer can recognize and display results for in the Element Detail panel under the Attributes section.
While you have the ability to store statistical test factors with assigned names, Visualizer is unable to recognize those names. Visualizer can only recognize a standard set of statistical test factors. (See Statistical Test Factor Attribute Association under SFHub Visualizer or Statistical Test Factor Attribute Association under SFAdmin, for more details.)
The ability to see your data in a more articulated and complete mode, by creating an attribute comparison chart that can be viewed in the Element Detail panel, Attribute section. (See Create an Attribute Comparison Chart under SFHub Visualizer or Create An Attribute Comparison Chart under SFAdmin, for more details.)
Statistical Test Factor Attribute Association
While you can use any attribute as a statistical test factor, Visualizer's ability to recognize that attribute as such depends on the attribute's name. Should the attribute name not match one of the standard statistical test factor names used by SFHub Visualizer, it cannot recognize the attribute as a statistical test factor.
If you use an attribute as a statistical test factor, you must associate that attribute with the applicable standard statistical test factor, in order for SFHub Visualizer to recognize the attribute as such.
To associate an assigned statistical test factor with a standard statistical test factor:
Ensure that you are either adding or modifying a display setting.
Create or Edit Display Settings, display setting
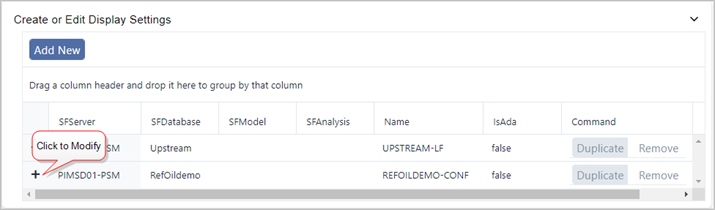
In this figure, we have selected an existing display setting. Clicking the + plus sign selects the display and opens its templates list, as shown in below figure.
Create or Edit Display Settings - Select template
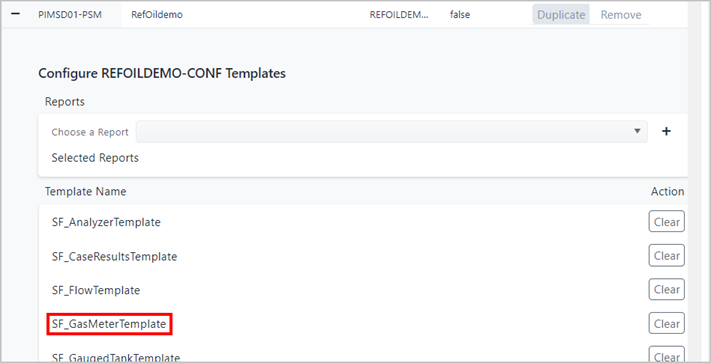
Ensure that you have already selected a Template. If you haven't, do so now by clicking on the template name (as shown in above figure)
In the list of Attributes in the bottom half of the panel, click on the Attribute that you need to associate its assigned statistical test factor name with its standard name.
List of Attributes - Expand Attribute settings
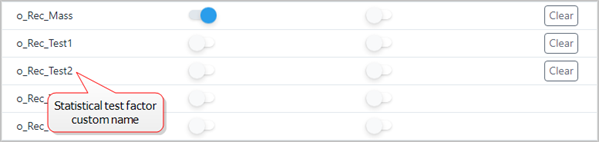
The settings are displayed.
Select Diagnostic Index
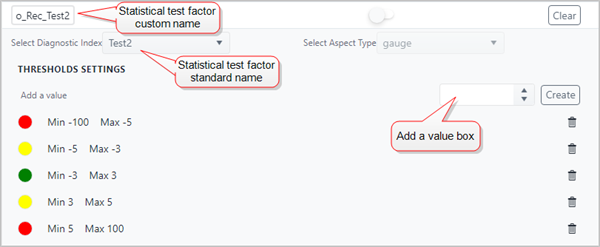
Click on the SETTINGS.DIAG_ IDX (Select Diagnostic Index in SFHub Admin) down-arrow and select the standard statistical test factor to which your statistical test factor relates.
As the association is created, the panel expands to display the 'Add a value' selector, which allows you to set additional thresholds (minimum and maximum ranges) for the standard test factor you have selected.
(Optional) To add a threshold:
a. In the Add a value box, type the starting value for the range you want to add, or us the up or down arrow to cycle through the values.
b. Click the Create button to add the value.
infoThe value is automatically placed in the proper location within the existing thresholds (ranges).
c. Repeat steps a and b for each range you want to create, ensuring that you always enter the minimum for each range. The range maximum is automatically set as you create the next minimum range number.
Each time a threshold is entered, the thresholds are recalculated, and the addition is inserted into its proper place within the existing thresholds.
In addition to the placement and recalculation of the thresholds, each is assigned a color that is used to represent it in the Diagnostic Panel gauge graphical representation of the test for the selected attribute. You can change the color for any of the threshold range sets by choosing a different color from the color picker.
(Optional) To change the color of a threshold range:
a. Click on the current color, as shown in the following figure.
A color selection panel opens.
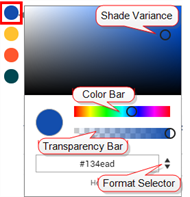
Color Selection panels in SFHub Visualizer and SFHub Admin, respectively
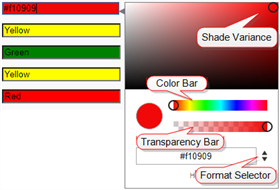
b. To change the shade of the current color, drag the Shade Variance circle around the display until you reach the shade you want.
c. To change the color itself, drag the Color Bar circle across the bar until you reach the color you want.
d. To change the transparency of the color, drag the Transparency Bar circle along the bar until you reach the transparency you want to use.
e. If you prefer to enter a color setting in Hexadecimal, RGB or HSLA format, use the Format Selector to select the format, and then enter the applicable color code(s).
f. When finished, click outside the panel to close it.
(Optional) To remove a threshold range, click on its
 trash can icon.
When finished with the settings for the selected Attribute, click on its name again, to close its settings panel.
Repeat the appropriate steps to modify additional attributes, under the same or different templates in the selected display setting.
Create An Attribute Comparison Chart
The Select Aspect Type setting provides the ability to create a comparison chart that allows you to see the data in a more articulated and complete manner. The charts allow you to obtain an immediate overview via a graphical representation, making review of data similarities and differences easier. A good example of the use for such a chart might be an Element that has Measured Mass and Reconciled Mass. You could create a chart to expose the difference between the measured mass and reconciled mass using a bar chart, to allow you to see the difference more easily.
To create an Attribute comparison chart:
Ensure that you are either adding or modifying a display setting.
Create or Edit Display Settings, display setting
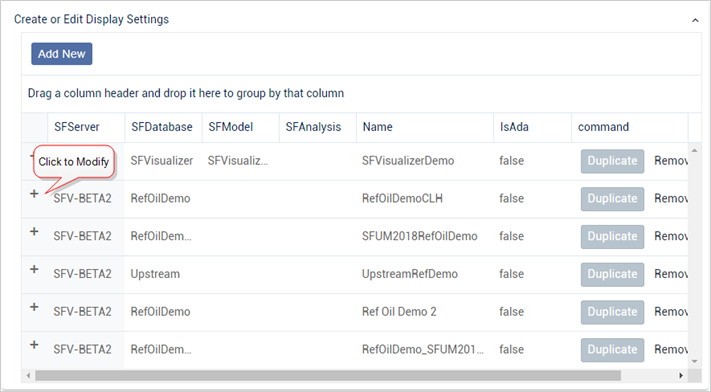
In this figure, we have selected an existing display setting. Clicking the + plus sign selects the display and opens its templates list, as shown in above figure.
Create or Edit Display Settings - Select template
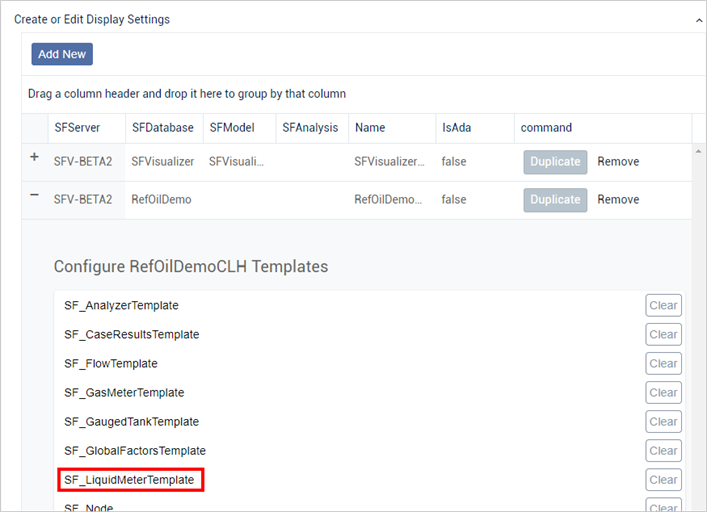
Ensure that you have already selected a Template. If you haven't, do so now by clicking on the template name (as shown in above fugure).
The panel expands to display the list of Attributes.
List of Attributes - Expand Attribute settings
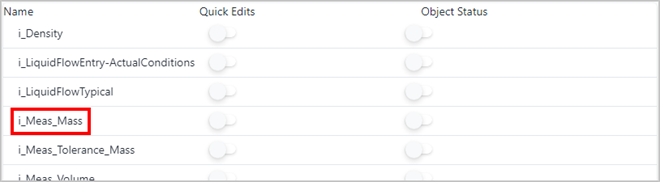
In the list of Attributes in the bottom half of the panel, click on the Attribute under which you want to create the comparison chart. Remember, the chart will display under this Attribute in the Element Detail panel, Attributes section.
The settings are displayed.
Select Aspect Type - choose Attributes in SFHub Visualizer and SFHub Admin, respectively
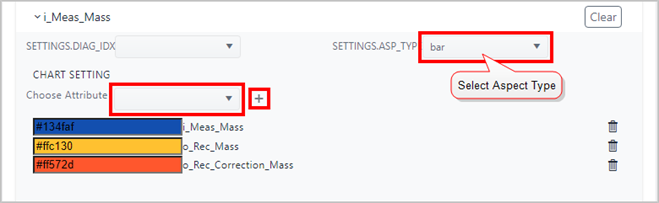
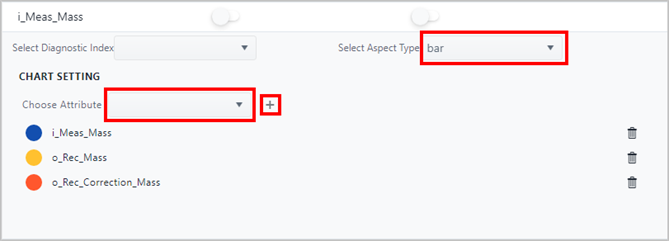
Click on Select Aspect Type (Select Aspect Type in SFHub Admin) down-arrow and select the style of the chart to use.
In our example, we have selected a "bar" graph chart.
Click on the Choose Attribute down-arrow and select the first Attribute you want to compare.
Click the
 Add button to add it.
Repeat steps 5 and 6 for the remaining Attributes you want to compare.
You will notice that each Attribute is assigned a color that is used to represent that Attribute in the chart. The colors can be changed by opening the Color Selection panel (See step 8).
(Optional) To change the default color that represents an Attribute in the chart: a. Click on the Attribute's current color circle, as shown in the following figure.
A color selection panel opens.
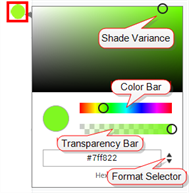
Color Selection panel in SFHub Visualizer and SFHub Admin, respectively
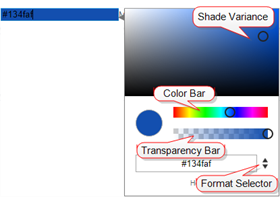
b. To change the shade of the current color, drag the Shade Variance circle to around the display until you reach the shade you want.
c. To change the color itself, drag the Color Bar circle across the bar until you reach the color you want.
d. To change the transparency of the color, drag the Transparency Bar circle along the bar until you reach the transparency you want to use.
e. If you prefer to enter a color setting in Hexadecimal, RGB or HSLA format, use the Format Selector to select the format, and then enter the applicable color code(s).
f. When finished, click outside the panel to close it.
(Optional) If you added an Attribute in error, click on its
Trash can icon to remove it.When finished with the chart settings, click on the Attribute name again, to close its settings panel.
Repeat the appropriate steps to create charts for additional attributes, under the same or different templates in the selected display setting.
Configurations are automatically saved.