Analytic Variables
The Analytic variables panel contains the list of all the analytic variables, Sigmafine analysis configuration parameters and user defined variables, along with their values and data types. The panel shows values in real-time when the debug stops at a break point. If the variable is a complex data type, like 'Dictionary', you can expand the variable content to view each individual value by clicking on the plus button at the left of the variable name.
The Analytic variables log is only available while Debug mode is running. Once Debug mode has completed, this tab is disabled.
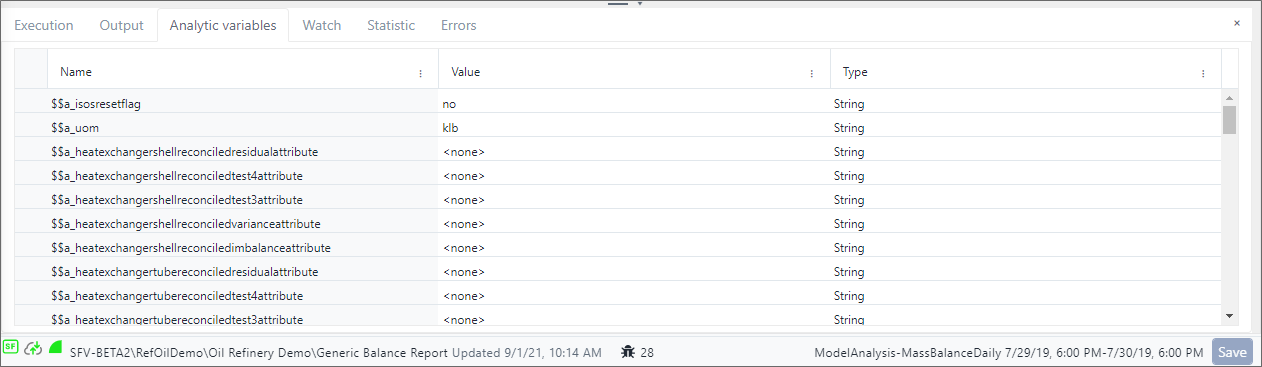
Example of Analytic variables panel
Each column includes an
![]() ellipsis that opens a Column Menu. The menu provides the ability to
choose the columns to display in the log table, and allows you to use filters to more easily find specific variables. See Column Menu for instructions on using this feature.
ellipsis that opens a Column Menu. The menu provides the ability to
choose the columns to display in the log table, and allows you to use filters to more easily find specific variables. See Column Menu for instructions on using this feature.
To work with the Analytic variables panel:
Click the Analytic variables tab.
The Analytic variables log panel displays a table with the following columns (as shown in Figure 1):
Name - This column lists the name of each variable encountered.
Value - This columns list the value for each variable.
Type - This column lists the type of each variable.
The variable information is for viewing only; editing cannot be done in the Debug Panel.
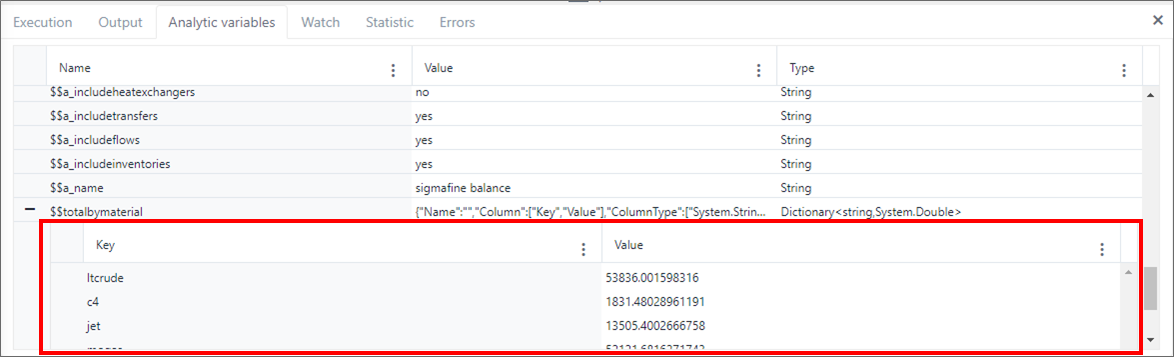
If a variable is a complex data type, like 'Dictionary', you can expand it to view its content.
(Optional) Click the + (plus) icon at the left of a variable name, to expand its content.
Expanded view of variable content
(Optional) Use the Column Menu to show or hide column in the log.
(Optional) Use the Column Menu to filter on column data so you can quickly find the variable information you want.
Column Menu
The Analytic variables panel includes an ellipsis icon for each of the columns in its log table, that opens a Column Menu. The menu includes two options; Columns and Filter.
Columns - allows you to choose what columns to show or hide in the table, while the
Filter - allows you to narrow the scope of the variables listed, so you can more quickly find a specific variable.
These two menu features are described in the following sections.
Show Hide Columns
You can choose to show or hide columns in the log by using the 'Columns' option from the Column menu. The Columns option allows you to select which columns you do and do not want to view in the log, allowing you to focus on only those columns you deem important for debugging. When a column displays a check, it indicates that the column will be displayed. By default, all columns are chosen for display.
To show or hide a column:
Click the
 ellipsis in any column to open the Column Menu.
Column Menu - Columns option

Choose Columns from the menu.
The menu expands to display the list of columns.
Select columns to display

All available columns are shown in the Columns list. Those with a check mark are the columns that are currently being displayed in the log. By default, all columns are checked meaning, they all are visible in the log.
To hide a column, click on its checked block to uncheck the block.
To show a column, click on its unchecked block to check the block.
(Optional) Click Reset to set the columns to the default.
Click Apply after you have made your choices to save them and immediately apply them to the log.
Filter on Column Data
You can use the 'Filter' option to narrow the log list using up to two values in combination with selectable filters and a conjunction. The Filter option reduces the table list's content based on the filter criteria you've entered. See 'Use Filters to Find Attributes' for more details on using this option.
To use the filter option:
Click the
ellipsis in the column you want to filter by, to open the Column
Menu.Column Menu - Filter option

Choose Filter from the menu.
The menu expands to display the filter options.
Filter on column data
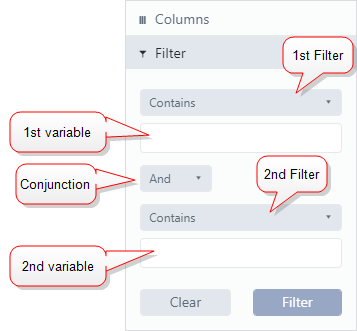
Click on the first Contains option arrow and select the filter you want to use.
In the text box below the first filter, type the variable/value to which you want to apply the filter.
Your entry should match the same type of data in the column on which you selected the Filter option.
If you want to use another filter or create a compound filter, click the Conjunction arrow and select the appropriate conjunction for your filters. Available conjunctions are "And" or "Or". If you only want to use the 1st filter, skip this step and go to step 9.
(Optional) Click on the second Contains option arrow and select the second filter you want to use.
(Optional) In the text box below the second filter, type the variable/value to which you want to apply this filter either in lieu of the first filter, or combination with it.
(Optional) Click Clear to clear the your filter criteria.
Click the Filter button.
The Column Menu closes and the log updates to display only those variables that match your filter criteria.
Filtered results example
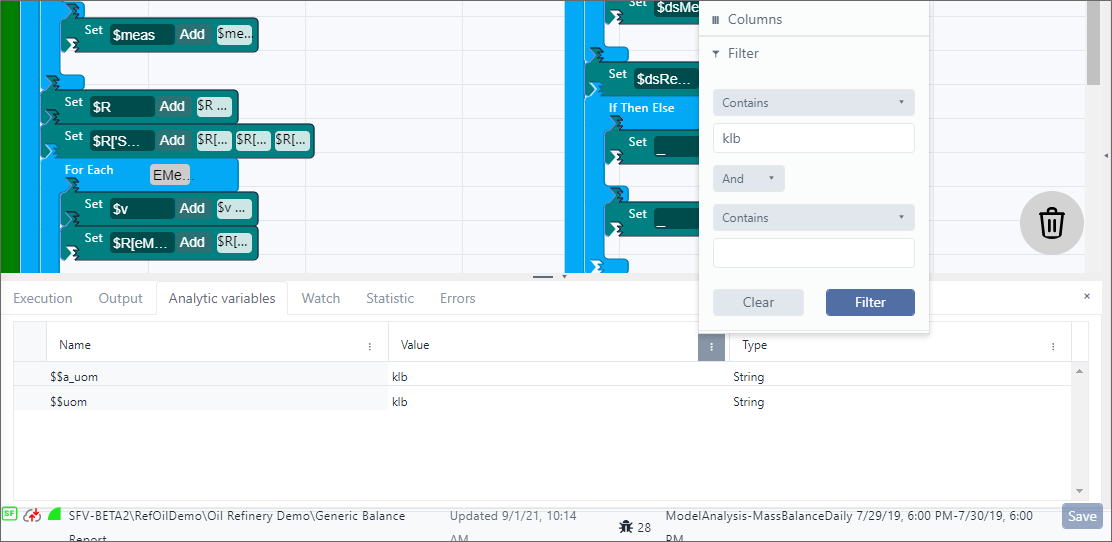
In this example, we set a filter to display only those variables with a 'Value' of "klb". Notice how the log table was updated to show only those variables that matched the criteria set in the filter.