Output
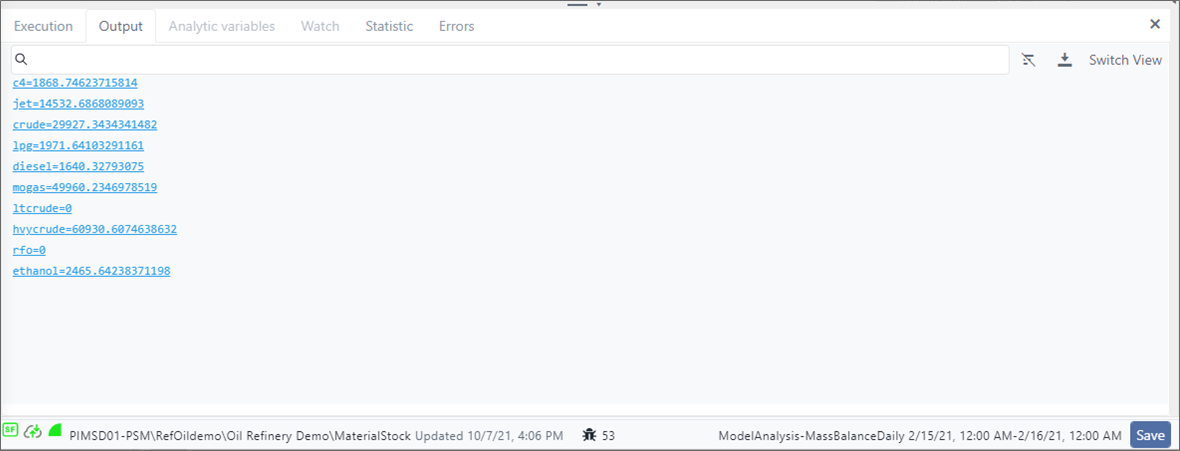
The Output panel contains the log entries generated by the Debug Print code blocks. Each entry has a hyperlink to highlight the code block that generated that specific log entry.
Example Output log panel
On the top right-side of the panel, there are some additional features that are outlined here.
Output log additional features
To work with the Output panel:
Click the Output tab.
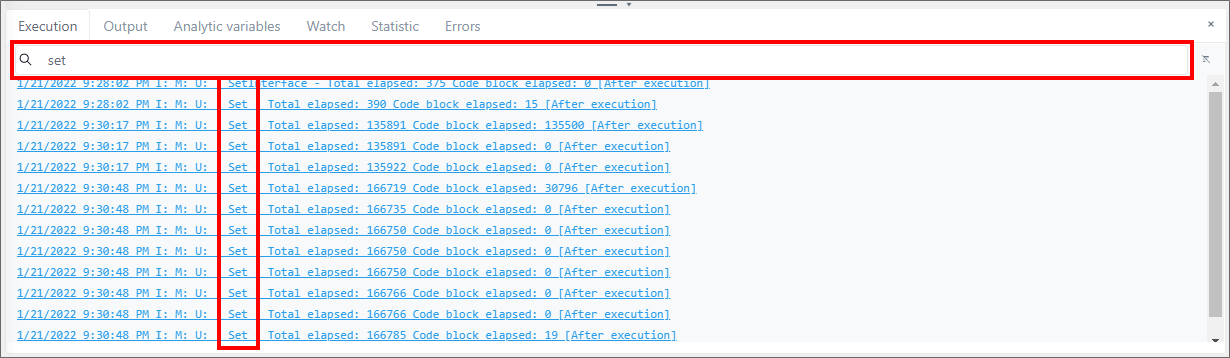
(Optional) Click in the Search box and type part or all of a term, to narrow the scope of the logged 'Debug Print' code blocks to only those that contain what you typed (as shown in the following figure).
Example Output log search
Highlight and delete the search term, to reset the log to display all 'Debug Print' code blocks again.
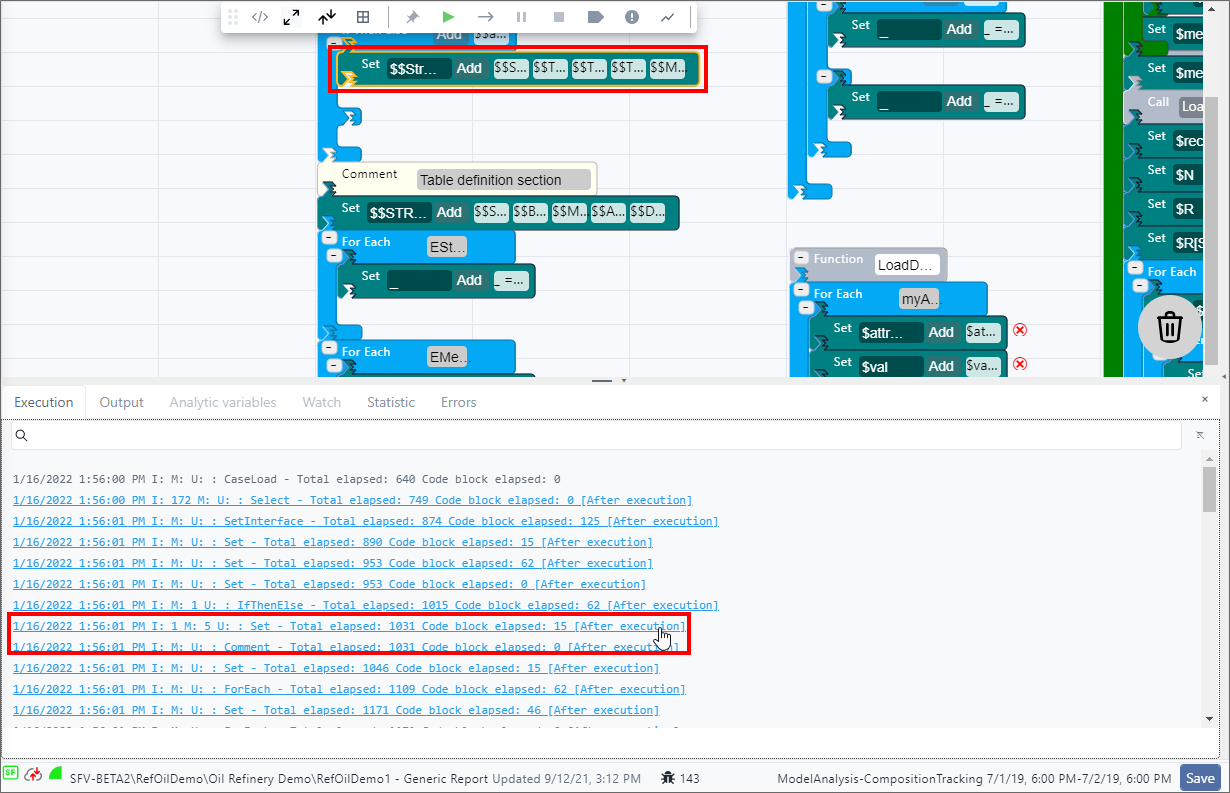
(Optional) Click on a code block in the log to highlight the Debug.Print that generated the message, in the analytic web editor panel, as shown in the following example.
Example of SFCode Block selected from log
(Optional) Click the Download icon to download and save the log to a CSV file, allowing you to open it in a spreadsheet application for better analyzing.
The following table provides the format of the columns, along with their descriptions.
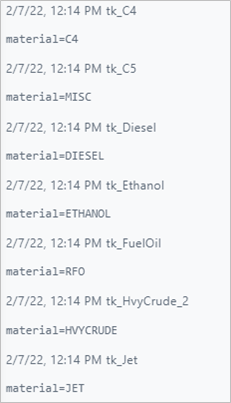
Column Description Element Name of the current element from which the message has been generated. Severity The Diagnostic Code parameter assigned to the Debug Print (see SFHubCodeBlocks reference manual) ParentElement Name of the parent element. The parent element is a virtual entity maintained by Studio while enumerating Connections. Type Always 1 for Debug Print Message The message printed out by the Debug Print TimeStamp The timestamp of the generated message (Optional) Click Switch View to change the display the messages by Element group, as shown in the following figure.
Output message grouped by Element
(Optional) Click the
 icon
iconCleared Output log panel
