Watch - tab
The Watch panel allows you to watch elements, their properties, variables, etc. as the analytic is running. A drop-down allows you to select the element to examine according to the current working space (set of elements) of the SFHub Studio Analytic.
The Watch tabbed panel is only available when in debug mode or when the execution stops at a break point.
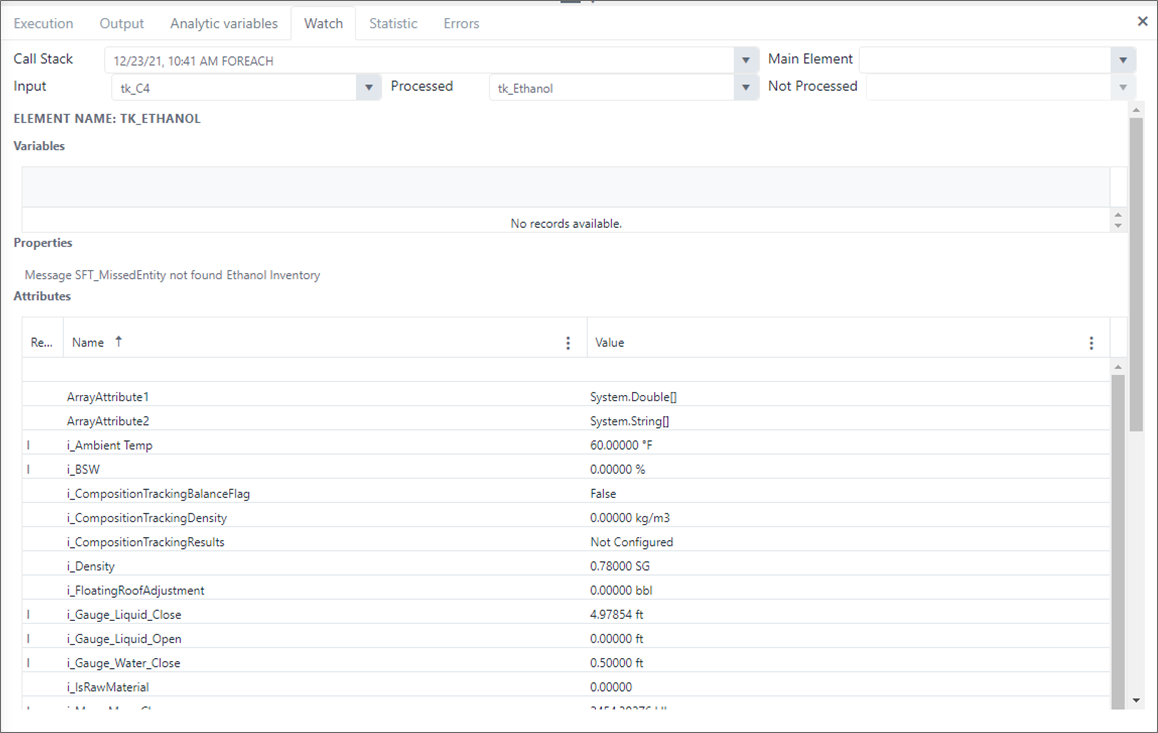
Example of the Watch panel
To work with the Watch panel:
Click the Watch tab.
The Watch log includes the following options:
Call Stack - Allows you to select a time in the current execution call stack, to see the elements and their details.
Main Element - Allows you to select an element from the input work space that represents the main element from which the analytic starts a navigation (e.g., enumerate connections).
Input - Allows you to select an element between the input working space to the selected code block in the call stack.
Processed - Allows you to select an element between the output working space to the selected code block in the call stack.
Not Processed - Allows you to select an element between the elements that have been discarded by the selected call stack time code block filters.
infoProcessed and Not Processed drop-downs are empty before the code block execution. You only see them populated after the execution. They show what elements of the working space have been processed or not, according to the configured logic (condition expressions, configured pattern).
Click the down-arrows of the option that coincides with the element you want to examine.
Select the element from the expanded list.