SigmafineHub® Studio Monitor
SFHub Administrators can use the SFHub Monitor page to monitor the status of the SFHub analytics currently in progress, and take some actions such as, stopping the analytic, whenever needed.
To open the Monitor page:
Click on the
 Monitor icon in the command
bar.
Monitor icon in the command
bar.The Monitor panel opens.
Monitor panel
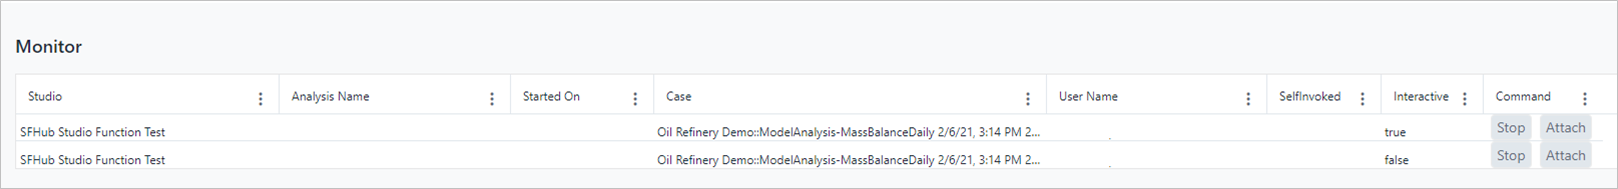
The following table describes all the columns that can be found on the Monitor page.
Column Description Studio Name of the Studio Project. Analysis Name Name of the analytic currently in execution. Started On Date and time when the analytic was activated. Case Sigmafine Case context under which the analytic is running (Model and Case time range are shown). User Name SFHub user that activated the analytic. SelfInvoked Interactive When True, it indicates that the analytic has been manually activated from the Analytic Web Editor for debugging purposes.
When False, it indicates that the analytic has been activated from a SFHub application (e.g., SFHub Visualizer, SFHub Studio Report or SFHub Studio Analytic).Command Stop - allows you to stop the execution of the analytic Attach - allows you to attach the analytic through SFHub Studio Analytic Web Editor to debug its execution.
- (Optional) Click the
 (vertical ellipsis), choose which columns you want displayed,
and then click Apply.
(vertical ellipsis), choose which columns you want displayed,
and then click Apply.- Check all columns that you want displayed.
- Uncheck all columns that you do not want displayed.
- Click Reset, to return to the original choices.