SFCode Block Debug Features
SFCode Block Debug Status
The Analytic status bar at the bottom of the Web Editor panel displays the current status of the Debug process, as well as the information about the analytic. When the Analytic has been assigned to a Case and its "run" process has been started, the Debug status area of the status bar displays a Debug icon and issue count. The Debug icon allows you to open the Debug panel to help you troubleshoot the issues, and the count provides the number of issues in real-time. There are three states of the Debug icon and count status; not displayed, displayed with a "0" count or displayed with a count of issues. These three states are described here.
Debug icon and count status not visible
When an analytic is not assigned to a Case, the analytic can't be run and therefore, the Debug icon and count status is not visible in the status bar, as shown in Figure 1.
Example: Debug Status is not visible
Debug Status not displayed
![]()
Debug icon and count status visible, but count shows 0
When an analytic is assigned to a Case, the debug status bar shows the selected Case on the right side.
If the analytic's "Run" process has not been started, the Debug count status displays 0, as shown in Figure 2.
Example: Debug status shows count is 0
Debug Status displays 0
![]()
Debug icon and count status visible, count shows current # of messages
When an analytic is assigned to a Case and its "Run" process has been started, the Debug count displays the number of issues found, in real-time. The counter increments with every issue it encounters.
Example: Debug status shows count # of issues encountered
Debug Status display when Case is selected and analytic is running
![]()
See Run and Debug an Analytic for more details about the Debug feature.
SFCode Block Debug Panels
The Debug panel provides information about issues that were encountered while an analytic was running. Its purpose is to help you troubleshoot and resolve encountered issues, so that your analytic can run successfully and provide accurate output.
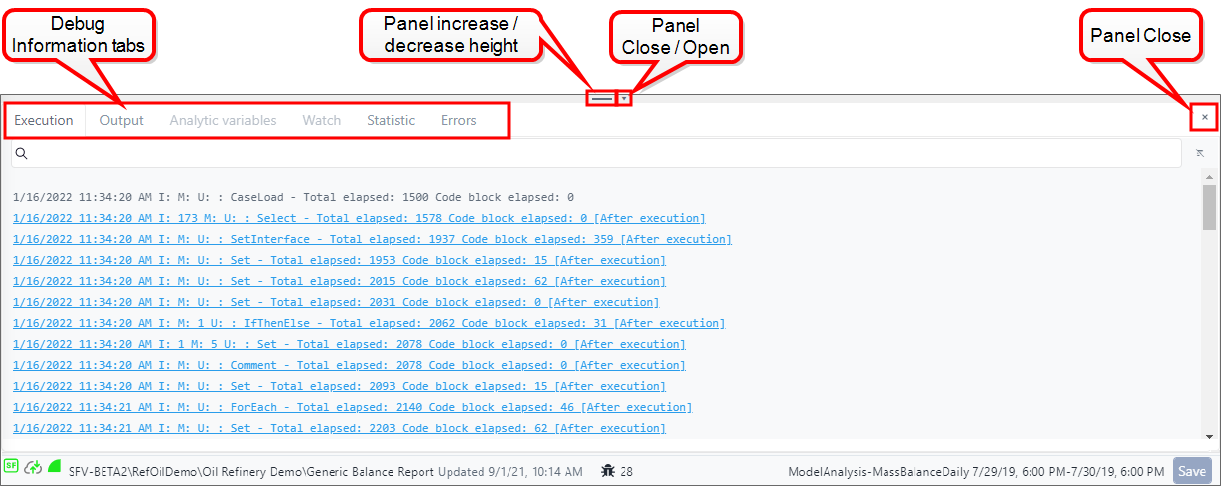
The Debug panel consists of 6 tabs, each containing specific information
to help you debug the analytic. There is also a standard panel
expand/contract icon, an icon that allows you to close and reopen the
panel and an icon to simply close it. The panel is closed by default,
but can be opened by clicking the
![]() Debug icon in the status bar, or
reopened by clicking the panel Close/Open icon.
Debug icon in the status bar, or
reopened by clicking the panel Close/Open icon.
Debug Panel example
The following table provides an overview of the debug information that can be found under each tab. Please see Step 4: Debug the Analytic for more details working with each panel.
Debug Panel descriptions
| Tab | Description |
|---|---|
| Execution | When the Execution log is enabled, this panel displays the log of every executed SFCode Block, in real-time. Execution panel 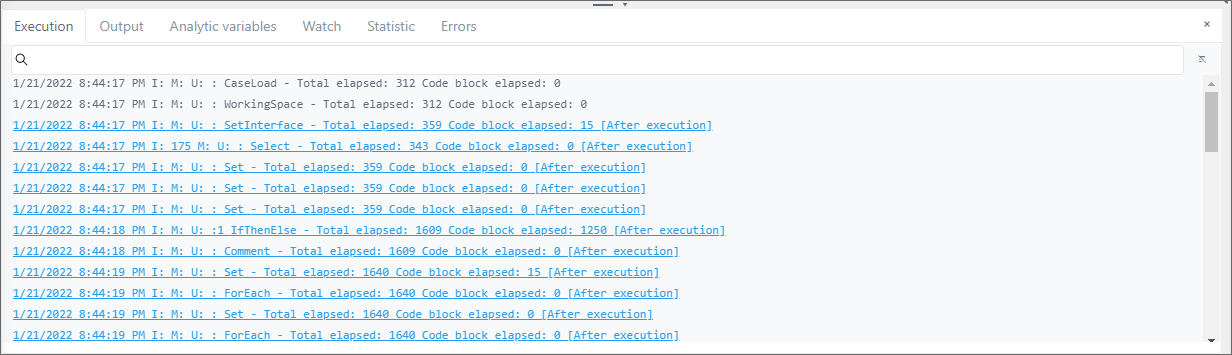 See Execution tab for more details. |
| Output | When the Output log is enabled, this panel displays the print out for every SFCode Block of type 'Debug Print', as well as any error messages raised during the execution of the analytic. Output panel 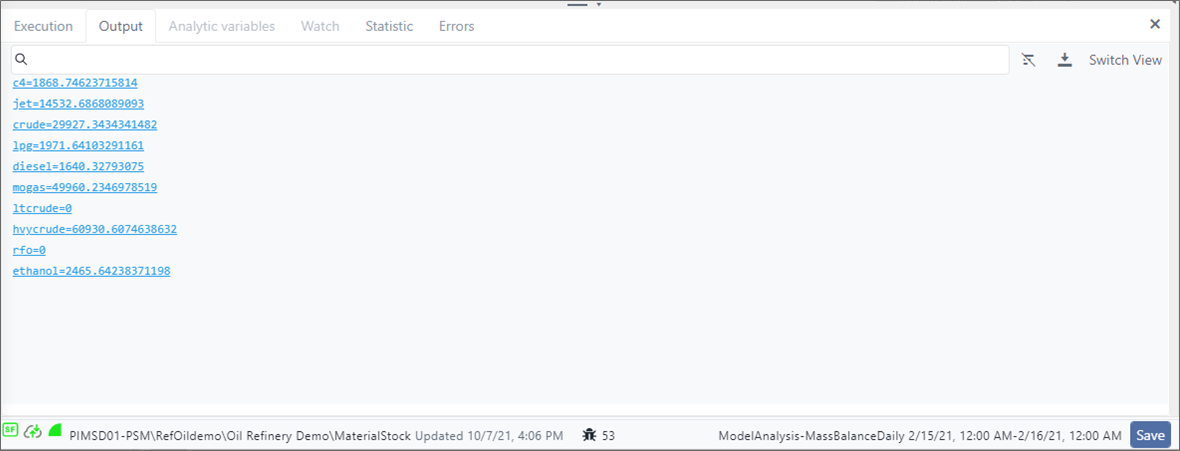 See Output tab for more details. See Output tab for more details. |
| Statistic | The Statistic panel displays a table that lists a summary of the execution counter, for every SFCode Block. Example Statistics table 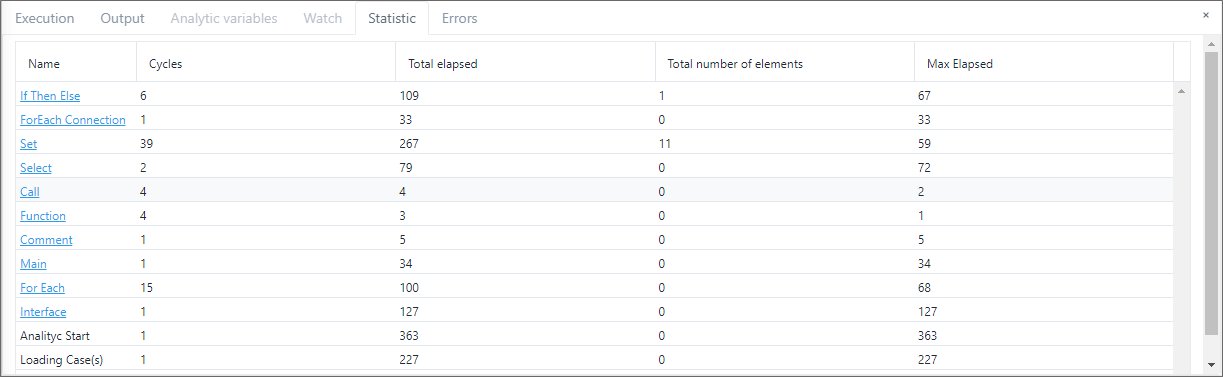 The Statistic log is only available after the analytic has completed the execution of all SFCode Blocks. See Statistic tab for more details. |
| Errors | The Errors panel displays a list of the errors the debug process encountered while the analytic was running. Example of SFCode Block selected from log 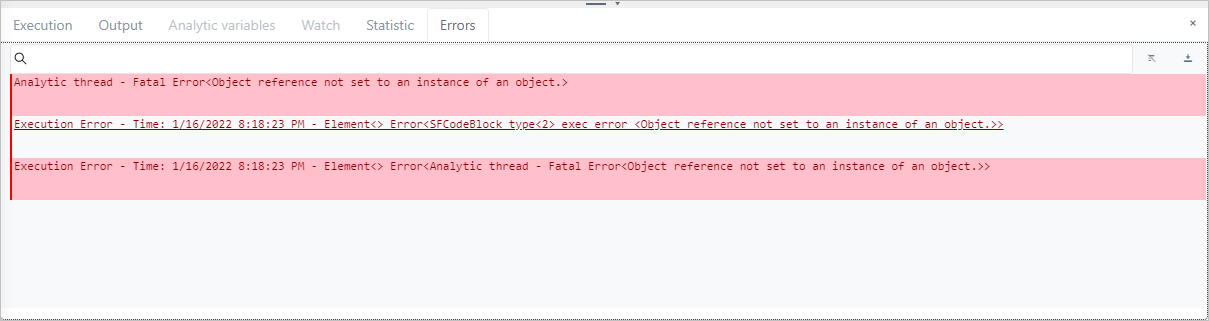 - -See Errors - tab for more details. |
| Watch | The Watch panel allows you to watch elements, their properties, variables, etc. as the analytic is running. A drop-down allows you to select the element to examine according to the current working space (set of elements) of the SFHub Studio Analytic. Watch panel 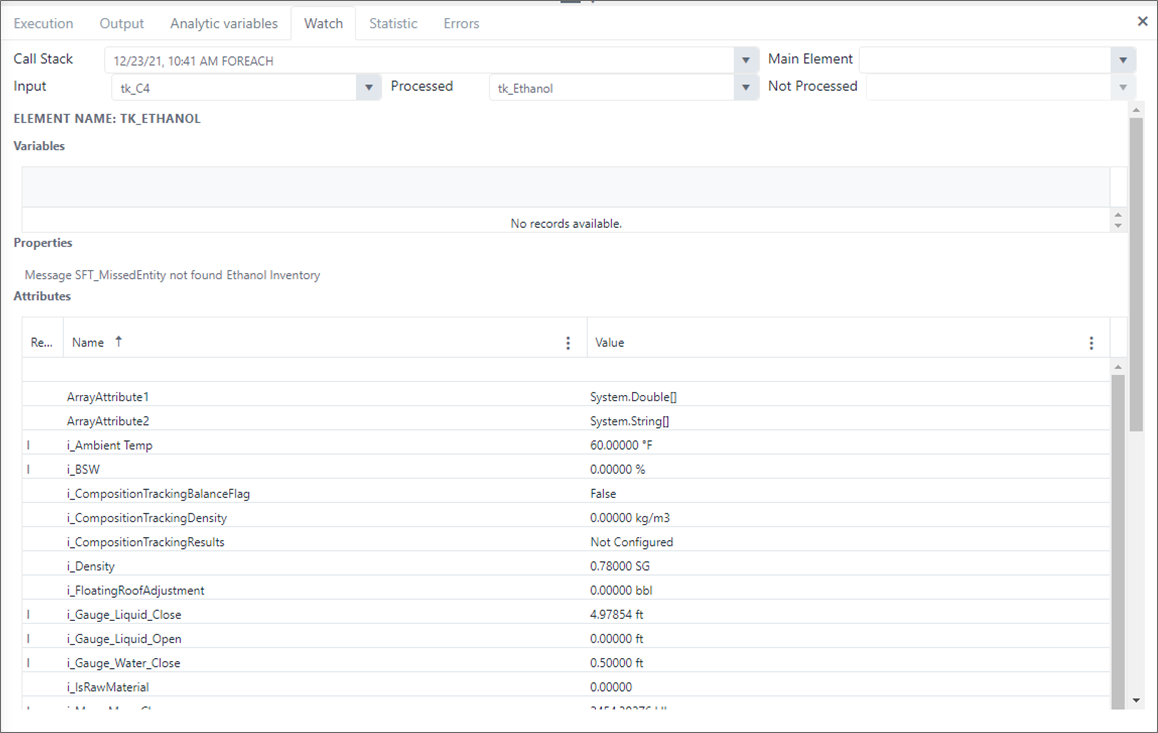 The Watch options are only available when in debug mode or when the execution stops at a break point. See Watch tab for more details. |
| Analytic variables | When running in Debug mode, the Analytic variables panel displays the log of all Sigmafine analysis configuration items, as well as the global variables defined in the SFHub Studio Analytic. Analytic variables panel 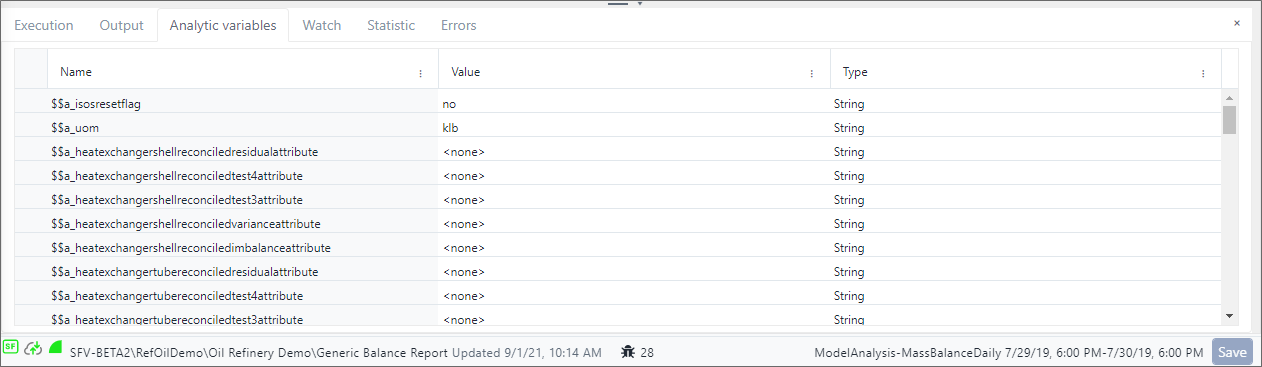 The Analytic variables log is only available while Debug mode is running. See Analytic Variables tab for more details. |
Please see Run and Debug an Analytic for instructions on running and debugging an analytic.