Use the Drop-Down Visual
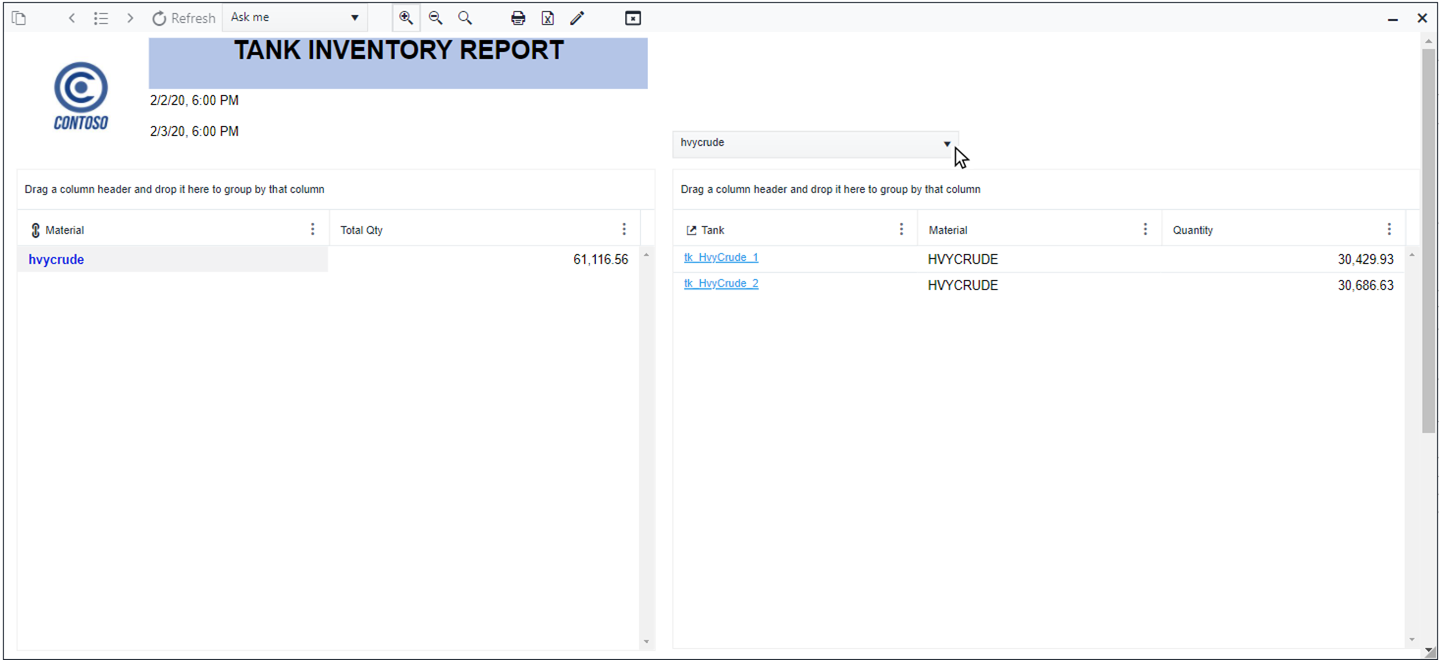
A Dropdown visual can be used to provide filtering options to the report. In our example we are using a drop-down to filter Table visuals according to the material code listed in the drop-down.
Open the Report.
a. Go to or reopen SFHub Studio.
b. Select the Project that contains your report.
c. Click the Report block in the Studio Project [project name] dashboard, to open the report in the design area. We opened the new report we created; Material Inventory Report.
Add the Dropdown visual object.
a. Double-click in the Design Area to open the Visual Object toolbox.
Visual Object Toolbox - Select Icon (Image)

b. Click on the Dropdown icon. The Icon visual container displays on the design area.
Icon Visual Container

Configure the Dropdown.
a. Click the Edit icon as shown in Figure 505. The Dropdown configuration panel opens.
Dropdown Configuration Panel
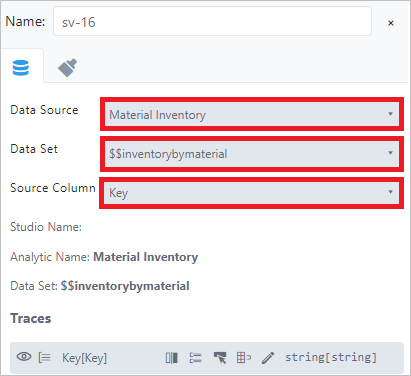
b. Click the Data Source tab, if not already open.
c. Choose the configuration you want to use. We used the same Data Source bounded on the first table
$$InventoryByMaterialthat is a SFHub Dictionary containing all the material codes.d. Drag the Dropdown to the top of the report where you want it to display in the report.
Configure the Interaction between the Dropdown and the Tables.
a. Move your mouse over the first Table visual object.
b. Click on the
 Edit icon, to open the Table visual object's configuration
panel.
Edit icon, to open the Table visual object's configuration
panel.c. Click the Interconnections tab to open its panel.
First Table Interconnections Panel
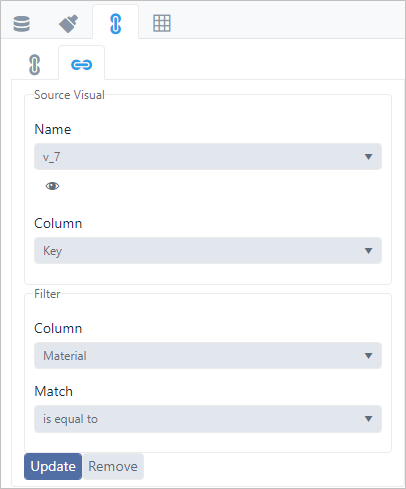
d. Click on the Name box and choose the name of the Dropdown.
e. Click on the first Column box and choose Key.
f. Click on the second Column box and choose the corresponding column in the Dropdown. The name should be the same for both columns.
g. Click on the Match box and choose the interaction. In our example, we chose "is equal to" as our interaction. The Look Up is configured on the Material column in order to narrow the content of the material quantity when a material is selected on the drop-down and since we have previously configured another interconnection between the two tables using the Material column as well. The second table is consequentially filtered when the drop-down is used.
h. Click Save (or Update) to save the interaction.
Click Save on the right side of the Status bar, to save the interaction you just added.
Run the Report in SFHub Visualizer.
a. Reopen SFHub Visualizer, if not still open in another browser instance.
b. Click the
 Report icon in the command bar and choose the report you
created.
We chose the 'Material Inventory Report' that we created.
Report icon in the command bar and choose the report you
created.
We chose the 'Material Inventory Report' that we created.
Choose tk_ltCrude_2 in the Model panel