Configure Interaction Between Visuals
In this step, we are going to add another visual to the report. Then we are going to configure an interaction between the two visuals, to narrow the content of the second table according to a selection on the first table.
Open the Report, if not already open.
a. Go to or reopen SFHub Studio.
b. Select the Project that contains your report.
c. Click the Report block in the Studio Project [project name] dashboard, to open the report in the design area.
We opened the new report we created; Material Inventory Report.Add the second Table visual object.
a. Double-click on the Report Design area to open the Visual Object toolbar.
Report Design Area - Visual Object toolbar

b. Click the Table icon, as shown in Figure 477.
The Table displays on the design area.
Table Visual Object

You can choose the visual and drag it anywhere in the design area.
You can also resize the visual by dragging on its bottom right-hand corner.c. Click the Edit icon of the visual object.
Visual Object - Edit Icon

The visual object's configuration panel opens.
Table Visual Object Configuration Panel
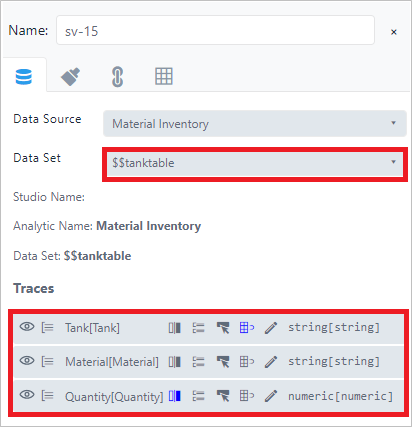
For this table, we chose the same Data Source as the first table and chose the analytic variable \$\$TankTable as the Data Set.
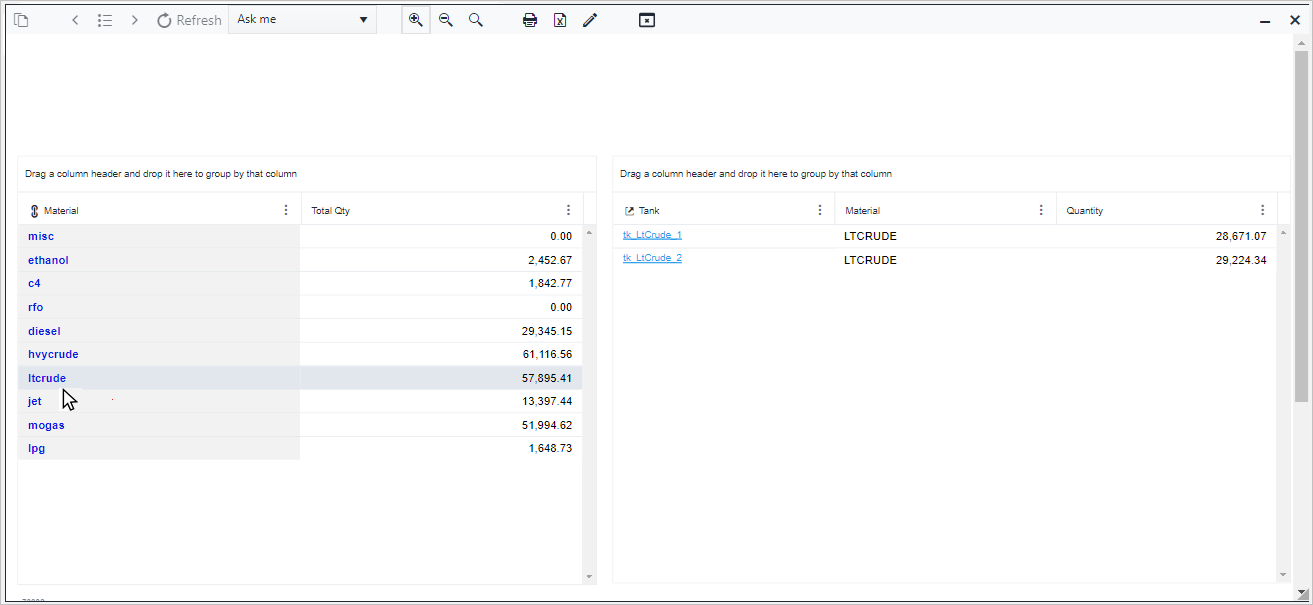
Both Tables in the design area are displayed as in the following example.
Report With Both Table Visuals

Configure the Interaction between the two visuals.
For our interaction, we want to configure the Look Up on the Material column in order to narrow the content of the material inventory by tank, when a material is selected (clicked) on the first table.
Change the Table columns caption.
a. Move your mouse over the second Table visual object.
b. Click on the
 Edit icon, to open the Table visual object's
configuration panel.
Edit icon, to open the Table visual object's
configuration panel.c. Click the Interconnection tab.
Table Visual Object Configuration Panel
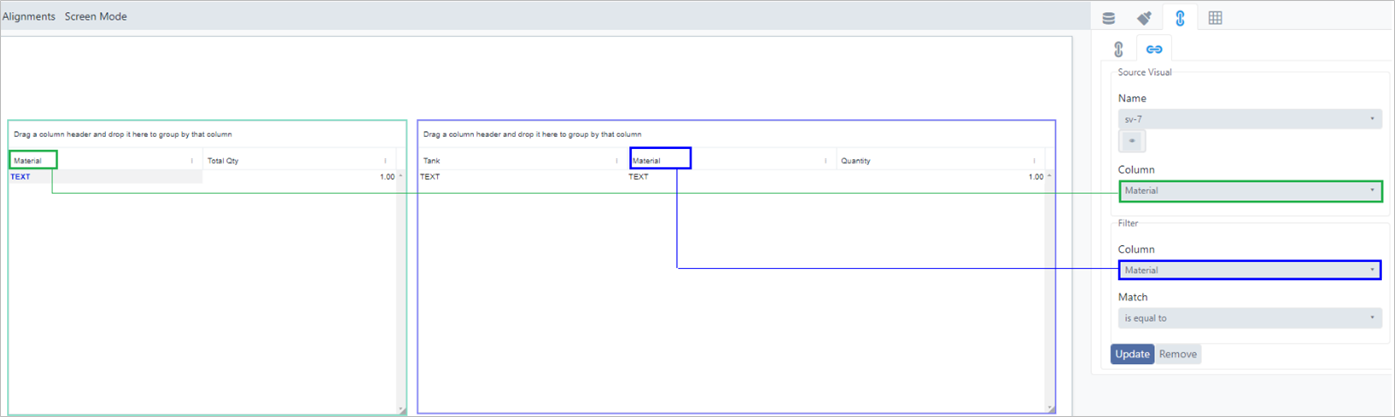
For our interaction, we want to configure the Look Up on the Material column in order to narrow the content of the material inventory by tank, when a material is selected (clicked) on the first table. Therefore, we are choosing the "Material" column in both table visuals; you can choose the columns you want for the interaction.d. Click on the Name box and choose the name of the first table.
e. Click on the first Column box and choose the name of the column in the first table visual.
f. Click on the second Column box and choose the corresponding column in the second table visual.
The name should be the same for both columns.g. Click on the Match box and choose the interaction.
In our example, we chose "is equal to" as our interaction.h. Click Save to save the interaction. The Table visuals are updated to reflect the interaction you just created.
Table Visual Updated