Use Chart
The last visual object we are going to add to the report is a Chart, to show the material inventories in bar graph graphical format.
Open the Report.
a. Go to or reopen SFHub Studio.
b. Select the Project that contains your report.
c. Click the Report block in the Studio Project [project name] dashboard, to open the report in the design area.
We opened the new report we created; Material Inventory Report.Add the Chart.
a. Double-click in the Design Area to open the Visual Object toolbox.
Visual Object Toolbox - Select Chart

b. Click on the Chart icon.
The Icon visual object displays on the design area.
Chart visual object

Configure the Chart Data Source.
a. Click the Edit icon.
Chart Edit Icon
 The Chart configuration panel opens.
Chart Configuration Panel

b. Click the Data Source tab if the panel is not already open.
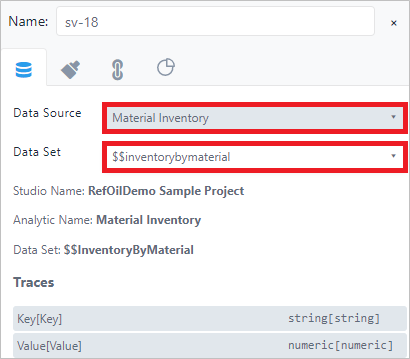
c. Configure the data source as needed for the report.
We chose the same Data Source bounded on the first table \$\$InventoryByMaterial that is a SFHub Dictionary containing all the material inventories and their quantities.d. Click the Chart tab to open its panel..
Chart Tab And Panel

e. Choose the Chart Type (Bar / Column)
Chart Type (Bar/ Column)

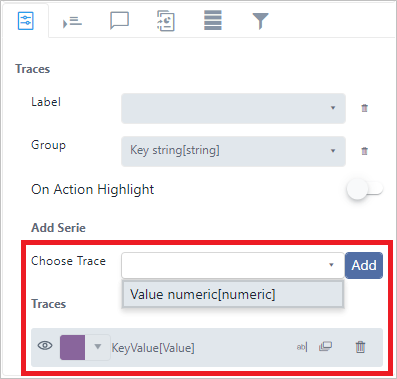
f. Choose the Series.
Chart Series

g. Configure the Group selecting the Key field.
The Key field represents the material code returned by the SFHub Dictionary configured on the Data Source.
Chart - Group Configuration

h. Add the Value field on the Traces.
The Value field represents the material total quantity returned by the SFHub Dictionary configured on the Data Source.
Add Value To Traces