Configure Report and Display Interaction
When you are working with a SigmafineHub Visualizer display and SigmafineHub Studio report, you have the ability to establish an interaction between the two applications, allowing you to work in an integrated manner.
For example, if want to localize the tank on the SFHub Visualizer Display, by clicking on the tank name showed in the report, you can configure the Backwards Lookup on the Table visual where the tank names are listed. Below are the steps to accomplish this.
Open the Report.
a. Go to or reopen SFHub Studio.
b. Select the Project that contains your report.
c. Click the Report block in the Studio Project [project name] dashboard, to open the report in the design area.
We opened the new report we created; Material Inventory Report.Configure the Backwards Lookup.
a. Move your mouse over the Table visual object that contains the "Tank" names.
b. Click on the
 Edit icon, to open its configuration panel.
c. Click the Data Source tab, if the panel is not already open.
Table visual object configuration panel
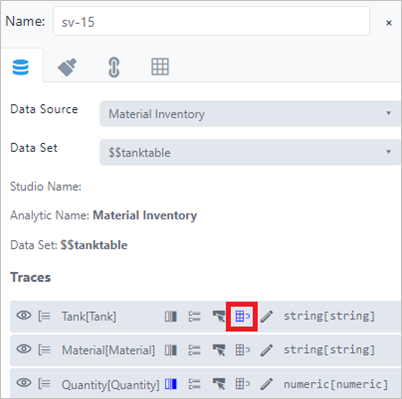
d. Click the Backwards Lookup icon on the column containing the tank name, to enable it.
Click Save to save the report.
Run the Report in SFHub Visualizer.
a. Reopen SFHub Visualizer, if not still open in another browser instance.
b. Click the
 Report icon in the command bar and choose the report you
created.
Report icon in the command bar and choose the report you
created.
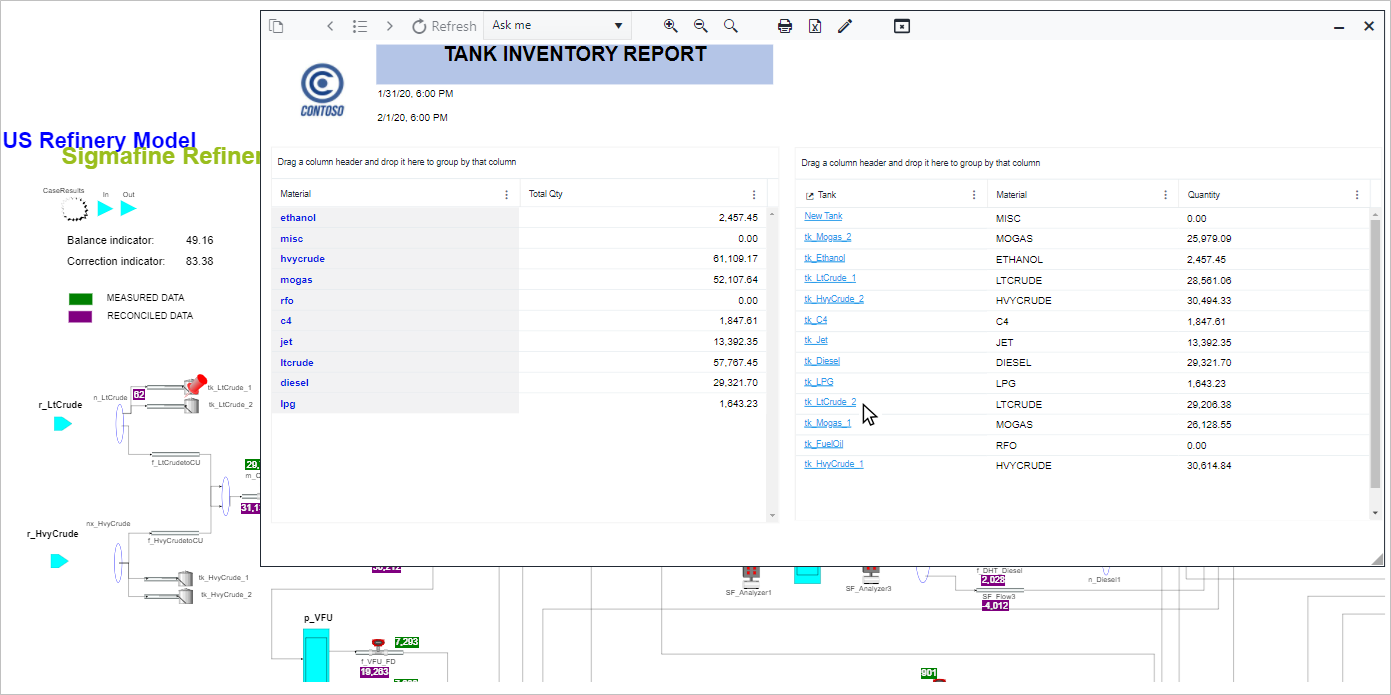
We chose the 'Material Inventory Report' that we created.c. Select the Case.
d. In the Model panel, click on a tank item.
We chose tk_ltCrude_2 (as shown in the following figure).
Choose tk_ItCrude_2 in the Model Panel
The Element Detail panel for the Tank element opens.
Element Detail Panel
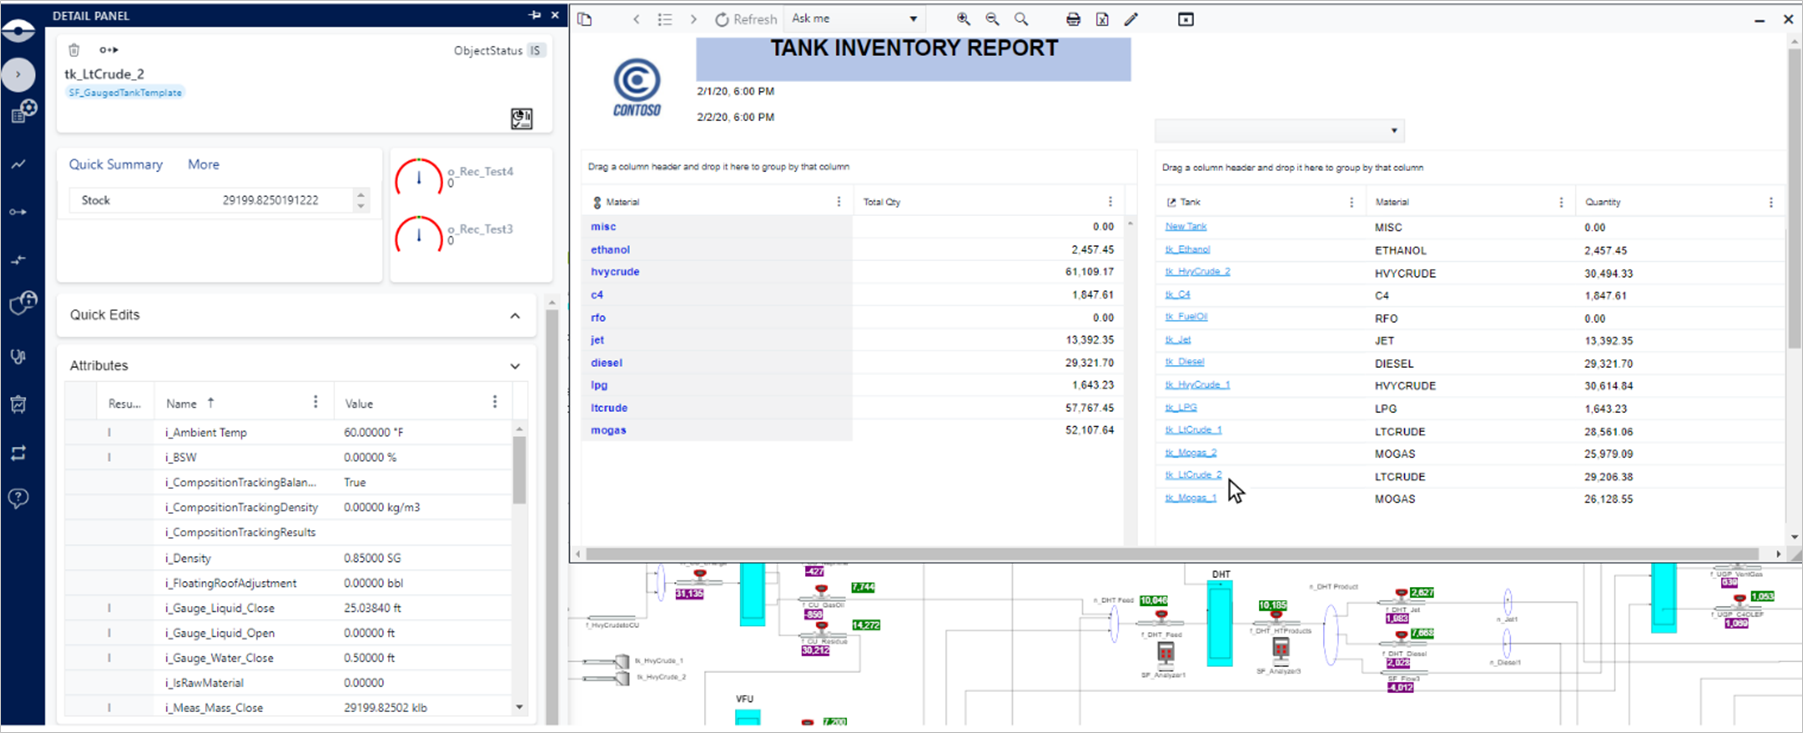
- Use the Report to make Adjustments.
In the SFHub Visualizer Element Detail panel, you have the ability to modify data (e.g., create Adjustments) according to the selected element on the report.