Settings - Series
![]()
The Series Setting is supported across all chart types
The Series sub-panel allows you to configure the series of data to be plotted in your chart. You can add one or more series according to the bounded Data Source and Data Set.

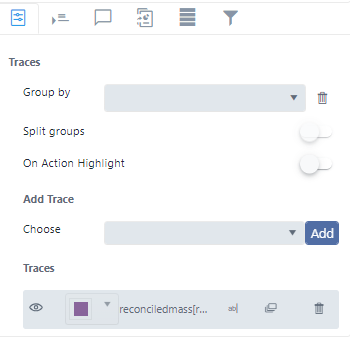
The Series sub-panel includes the following settings:
Group By
Group by allows you to configure a first level grouping
of the data traces. You can choose between the data
source columns not yet used in the trace configuration.
Click the trash can icon (![]() ) to remove a selection.
) to remove a selection.
Split groups
This setting allows to place groups of series on separate stacks.
On Action Highlight
Series and individual points are highlighted when hovered or tapped. You can customize or disable the highlight effect by using this settings.
Add Series
Add Series allows you to add data series to the chart.
You can choose between the numeric columns from
the source dataset.
Click on Add (![]() ) to add the chosen trace to the chart traces.
) to add the chosen trace to the chart traces.
Traces
Traces displays a list of the configured data traces for the chart, allowing for the configuration of each one.
Traces Visibility
![]()
When clicked, it allows you to hide/show the column on the chart.
Trace Color
![]()
Allows you to choose the data trace color in the chart.

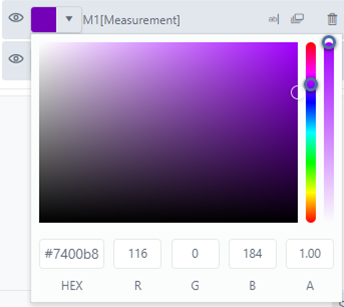
If 'Label' or 'Group' are chosen, the color selection is disabled.
Trace Name
![]()
When clicked on, it shows a panel that allows you to enter a name for the current trace.


Numeric Format
![]()
When clicked, it shows a panel that allows you to configure the decimal digits of the data trace numbers that will show on the chart.


Aggregation Rules
![]()
When clicked, it shows a panel that allows you to configure the aggregation rules for each trace.

Aggregate allows you to choose the aggregation rule to be applied (sum, count, average, min or max). The condition (is equal to, is not equal to, is equal and greater to, is equal and lesser to, greater or lesser) and value drop-down allows you to filter the trace data to be aggregated.
Click Reset if you want to clear the aggregation configuration for the selected trace.
Remove Trace
![]()
When clicked, it remove the trace from the chart.