Report General Info Panel
The Report General Info panel allows you to set up the basic report information such as the name, the type of report, where the report is to pull data from and the defaults to be used to format the appearance of that data.
Report General Info panel

The Report General Info panel consists of six tabbed panels:
General tab
The General tab is used to assign a name and description. The assigned name is the name visible from SFHub applications.
Type tab
The Type panel is used to characterize the type of report. You choose a Level and can optionally choose Templates. There is also a 'Categories' option, though it is not yet functional.
Report General Info panel - Type tab

Level
The Level option allows you to define at which level of the Sigmafine organization the report is to be shown.
There are three levels to choose from; Case, Element and Case, and General.
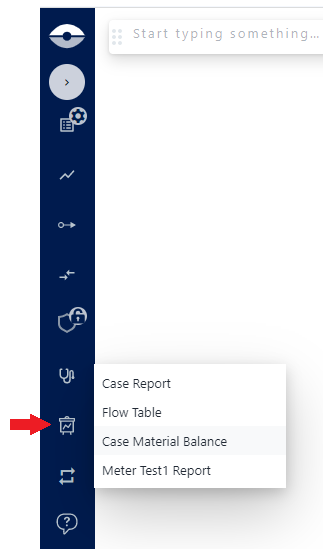
Case: Indicates that the Report is pertinent to the whole Sigmafine Case elements of the Sigmafine model (e.g., a report showing the summary of the materials stock).
When this level is selected means that the report can be visualized in the context of the selected Sigmafine Case. For example, in SFHub Visualizer the report short cut will be visible on the Visualizer navigation bar: Report icon on Visualizer navigation barReport icon - on Visualizer nav bar
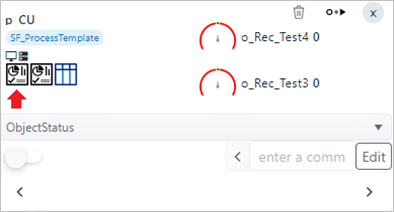
Element and Case: Indicates that the Report is pertinent to a well-defined element of the Sigmafine Case (e.g., a report showing the summary of the balance information of a balance point).
When this level is selected, it means that the report can be visualized in the context of a selected element. For example, in SFHub Visualizer the report short cut will be visible on:
Element Tooltip example
Element Tooltip Report Icon
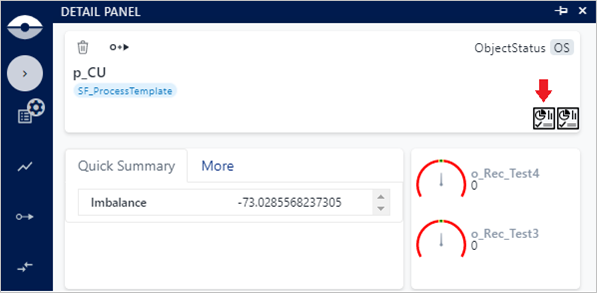
Element Detail Panel Report Icon
General: Indicates that the Report is not related to one Sigmafine Case, as an example a report showing the trend of the DX indexes in a time period. Reports of level “General” shall be visible in SFHub Visualizer through the report short cut on the Visualizer navigation bar (see previous example)
Data Sources tab
The Data Sources tab displays the summary of the data sources referenced by the Visuals.
Visual Interconnection tab
The Visual Interconnection tab displays the summary of the interconnections configured on the Visuals.
Interface tab
The Interface panel displays the list of the interfaced exposed by the SFHub Studio Analytics referenced by the visuals in your report (see the Interface the "SFCodeBlocks Reference Guide"). This panel also allows you to change the interface parameters, in order to customize the data shown by the report. See How the Interface Panel Works for further details.
Style tab
The Style panel allows you to setup the default general aspect styles to be applied to all the visuals to be included in the report. Through this panel, you can show or hide the grid line of the Report dashboard, as well as choose its size and enable or disable the snap of the visual objects on the grid.