Configure Attributes for Quality Tracking
After creating or loading the new required attributes, they must be configured according to the guidelines.
Analyzers
The following table provides guidelines for analyzers.
Guidelines for Analyzers
| Attribute | Description |
|---|---|
| MeasurementType | Attribute used to qualify the quality type of the analyzer (this value can be inherited by the Attribute template itself). |
| MeasuredAnalysis | Attribute used to configure the PI Point data reference on a PI tag containing the values for the analyzer. |
| MeasurementCount column | Attribute used to configure the PI Point data reference on the same PI Tag of the MeasuredAnalysis attribute, but with a different configuration to count the number of new values provided by the PI Tag in the current case. |
MeasurementCount is configured to count the number of new values provided by the PI Tag in the current case, therefore, it should be filled with the following string:
'=\\SERVERNAME\PITAGNAME.XX;TimeMethod=TimeRange;RelativeTime=1;TimeRangeMethod=Count;TimeRangeBasis=EventWeighted;TimeRangeMinPercentGood=5;UOM=count
Configuring the Analyzer Attributes
To configure the Quality Tracking - Analyzer attributes:
Open a new Microsoft Excel spreadsheet file.
Select the PI AF Builder tab.
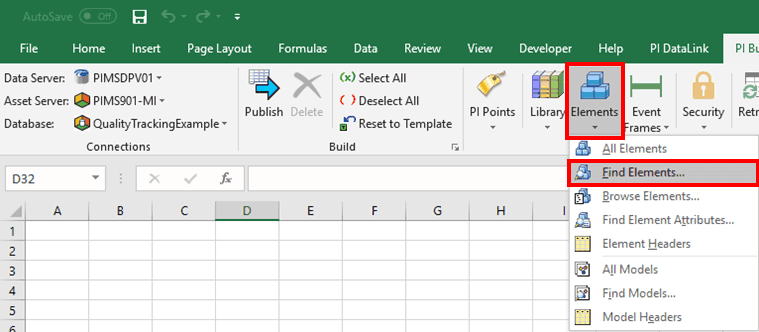
Click on the Element icon.
Select Find Elements.
The Element Search window opens.
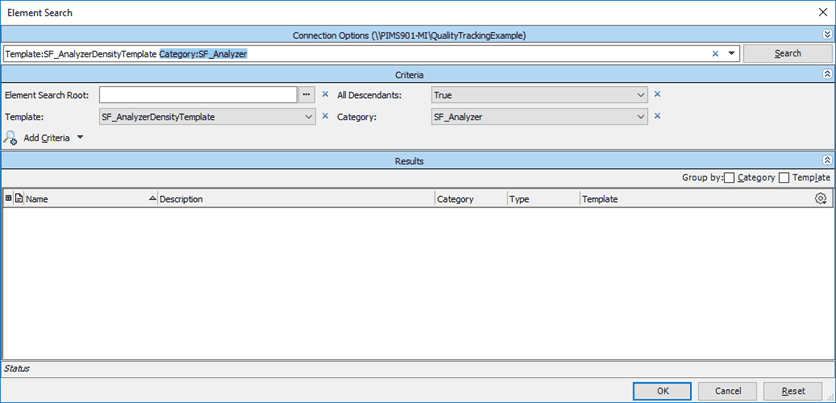
Click the Search button.
Click OK.
The Select Object Types and Column Headers window opens.
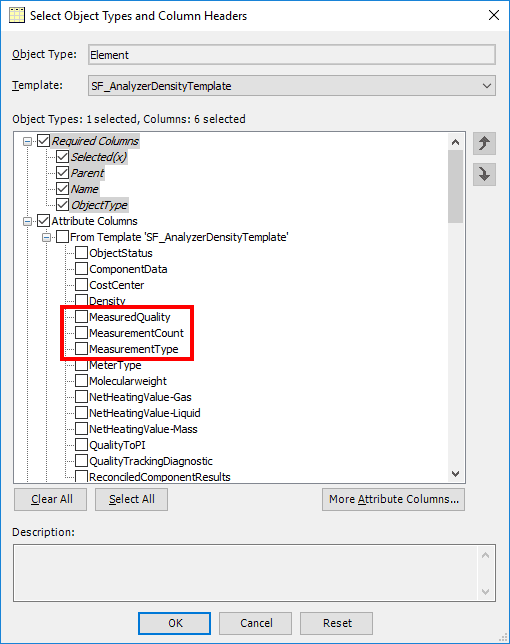
Click the More Attribute Columns button.
Select the following attributes:
- MeasurementType
- MeasuredQuality
- MeasurementCount
Click OK to save your selections and return to the Select Attributes window.
The Attributes you selected are added to the list in the Select Attributes window.
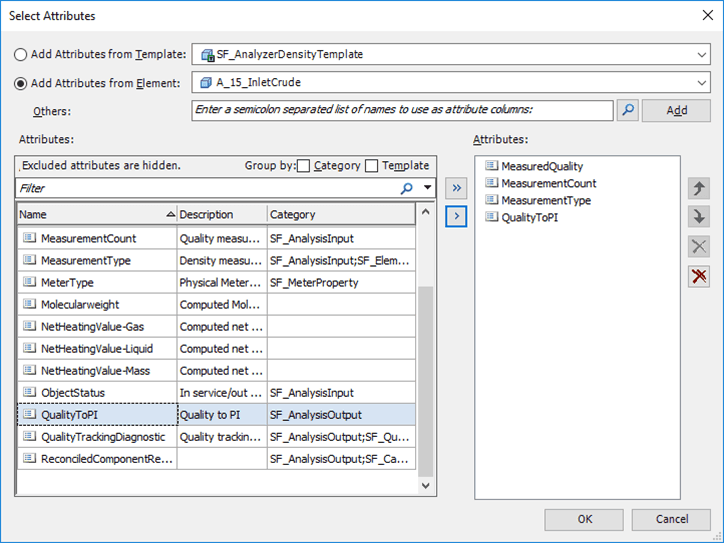
Select and add the attributes(MeasurementType, MeasuredQuality, MeasurementCount) to the Attributes on the right in the Select Attributes window.
Also select and add the template to the Attributes on the right (In our example we used the QualityToPI template).
Click OK to save your selections and close the Select Attributes window.
The entire list of analyzers for the Model appear in the Excel spreadsheet.
 EXAMPLE: Selected Model with list or analyzers
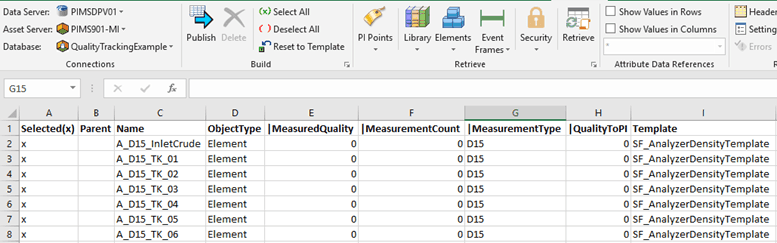
Note: We strongly recommend that you make a backup copy of this file before modifying it. This will allow you to have the possibility to restore the original configuration in case of mistakes or bad configurations.
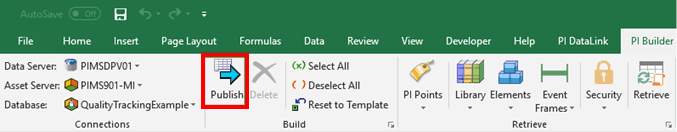
Once all the columns are filled with values, click the Publish button as shown in the following figure.
Flows
The following table provides guidelines for flows.
Guidelines for Flows
| Attribute | Description |
|---|---|
| QualityTrackingBalanceFlag column | Set the value to 'True' for all flows which should be involved in the QualityTrackingAnalysis. For those that should be excluded, set the value to 'False'. |
Configuring the Analyzer Attributes
To configure the Quality Tracking - Analyzer attributes:
Open a new Microsoft Excel spreadsheet file.
Select the PI AF Builder tab.
Click on the Element icon.
Select Find Elements.
The Element Search window opens.
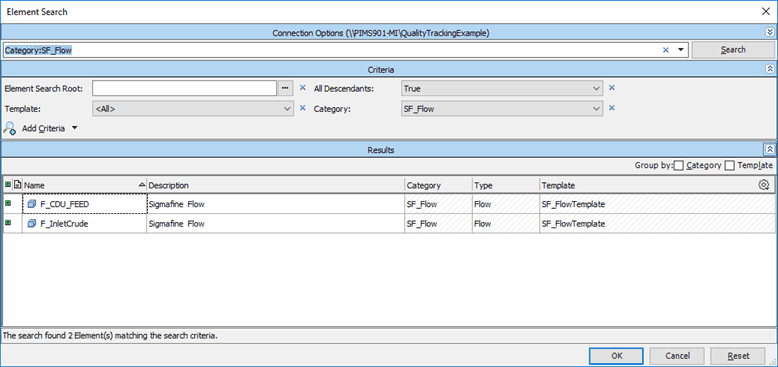
Select the Sigmafine Model and SF_Flow category.
Click the Search button.
Click OK.
The Select Object Types and Column Headers window opens.
Click the More Attributes Columns button.
Select the QualityTrackingBalanceFlag attribute.
Click OK to save your selection and return to the Select Attributes window.
Figure 1334 : Select Attributes - Add Attributes from Element
Select and add the QualityTrackingBalanceFlag Attribute from the list on the left to the Attributes on the right.
Click OK.
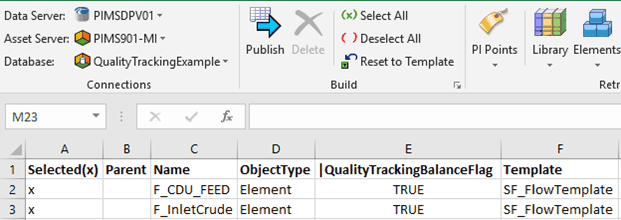
The list of flows appear in the selected Model in the Excel spreadsheet.
Once all the columns are filled with values, click the Publish button as shown in the following figure.
Tanks
To configure the Quality Tracking - Tanks attributes:
Open a new Microsoft Excel spreadsheet file.
Select the PI AF Builder tab.
Click on the Element icon.
Select Find Elements.
The Element Search window opens.
Select the Sigmafine Model and SF_Tank category.
Click the Search button.
Click OK.
The Select Object Types and Column Headers window opens.
Click the More Attributes Columns button.
Select the QualityTrackingBalanceFlag attribute.
Click OK to save your selection and return to the Select Attributes window.
Select and add the QualityTrackingBalanceFlag Attribute from the list on the left to the Attributes on the right.
Click OK.
The list of tanks appear in the selected Model in the Excel spreadsheet.
Once all the columns are filled with values, click the Publish button as shown in the following figure.
Nodes
To configure the Quality Tracking - Nodes attributes:
Open a new Microsoft Excel spreadsheet file.
Select the PI AF Builder tab.
Click on the Element icon.
Select Find Elements.
The Element Search window opens.
Select the Sigmafine Model and SF_Nodes category.
Click the Search button.
Click OK.
The Select Object Types and Column Headers window opens.
Click the More Attributes Columns button.
Select the QualityTrackingBalanceFlag attribute.
Click OK to save your selection and return to the Select Attributes window.
Select and add the QualityTrackingBalanceFlag Attribute from the list on the left to the Attributes on the right.
Click OK.
The list of tanks appear in the selected Model in the Excel spreadsheet.
Once all the columns are filled with values, click the Publish button as shown in the following figure.
Receipt Points
To configure the Quality Tracking - Receipt Points attributes:
Open a new Microsoft Excel spreadsheet file.
Select the PI AF Builder tab.
Click on the Element icon.
Select Find Elements.
The Element Search window opens.
Select the Sigmafine Model and SF_ReceiptPoints category.
Click the Search button.
Click OK.
The Select Object Types and Column Headers window opens.
Click the More Attributes Columns button.
Select the QualityTrackingBalanceFlag attribute.
Click OK to save your selection and return to the Select Attributes window.
Select and add the QualityTrackingBalanceFlag Attribute from the list on the left to the Attributes on the right.
Click OK.
The list of tanks appear in the selected Model in the Excel spreadsheet.
Once all the columns are filled with values, click the Publish button as shown in the following figure.