Search & Display SOA Publisher Trace Messages
The SOA Publisher Connector and SOA Publisher Dataset includes a Log tab that lets you search and display the trace messages generated for the SOA Publisher. Traces and Logs are packed by “executions” or “calls”. Meaning that a new set of trace/log messages is created each time a call is invoked for the selected SOA Publisher.
To search for and display the trace messages and logs:
Run the Integration Framework Configurator.
Click on your Windows Start button to display the list of installed software applications.
From the list of software applications, select Integration Framework > Configurator.
Under Configured Data Server, locate and select the SOA Publisher Connector or SOA Publisher Dataset.
The associated SOA Publisher window opens to the first tab.
Click on the Log tab to display the exposed trace message executions list for the connector or dataset.
The following figure displays the SOA Publisher Dataset Log tab. The SOA Publisher Connector Log tab is very similar in appearance.
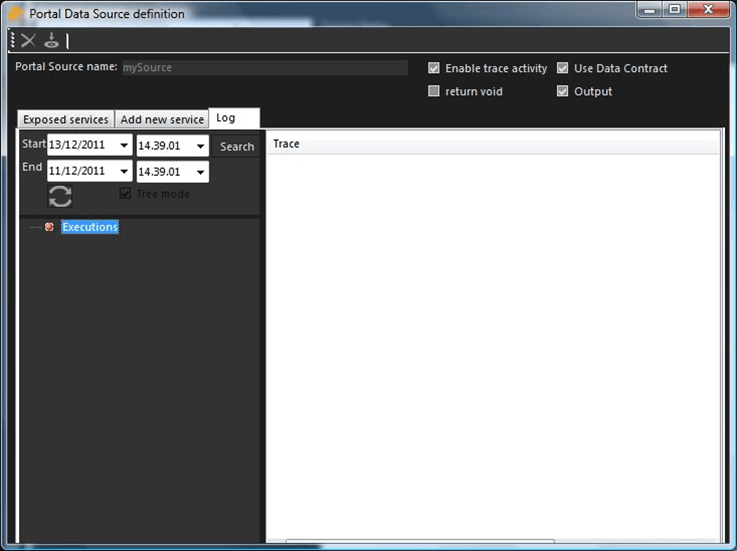
The Log tab includes three areas; one for entering search criteria, below that a list of the trace logs by date and time, and to the right, the content of the selected trace log.
To search for a specific date/time range:
Enter the Start and End date and time values in the appropriate search boxes.
Start = NOW -2 days
End = NOW
Click the Search button to search for all execution traces within the entered date/time range.
The Executions tree refreshes to show all the trace logs for the entered time/date range.
To view the message for a trace log, in the Executions list, locate the execution date/timestamp and select it.
The content of the trace log is displayed in the Trace pane on the right.
To refresh the trace list, click the Refresh icon in either the toolbar or in the Search area.
This action ignores your date/time entries and instead, resets the Executions list back to the original list.
To change the Executions list from a "tree" view to a simple list view, remove the check from the Tree Mode checkbox.
When finished, click the Exit icon to close the window.