Create a Report
In order to create a report, you need to have a project open, and that project must that include one or more analytics. Once you have opened the project you want to create a report for, you can begin to create the report from either the Project project name dashboard under the Report column or from the Report project name dashboard.
| Project project name | Report project name |
|---|---|
| Dashboard example | Dashboard example |
![Figure 362: Project [project name] Dashboard Example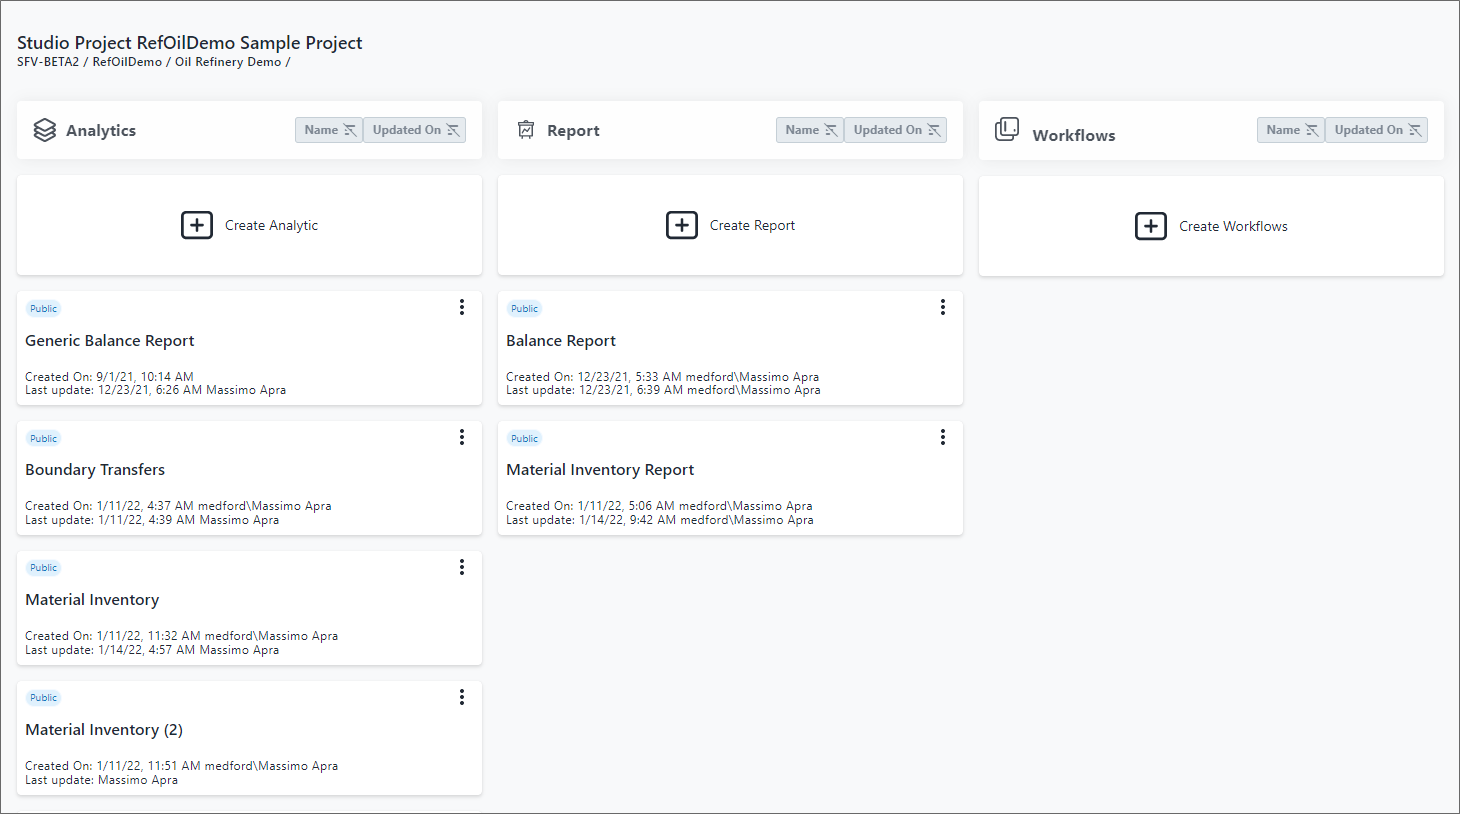 | Figure 363: Report [project name] Dashboard Example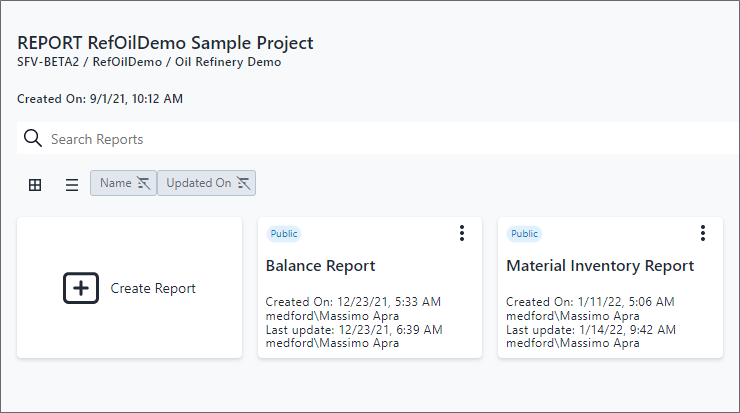 |
The following steps walk you through the process of creating a report's basic setup, however for greater details and definitions, please see the "Report Web Editor" Report Web Editor and "Build Report Step by Step" Build Reports Step by Step sections in the SFHub Studio Guide,topics for more in-depth details and steps.
To create a report:
Open your Studio Projects dashboard, if you have not done so already.
To open click
 Home in the command bar.
Studio Projects
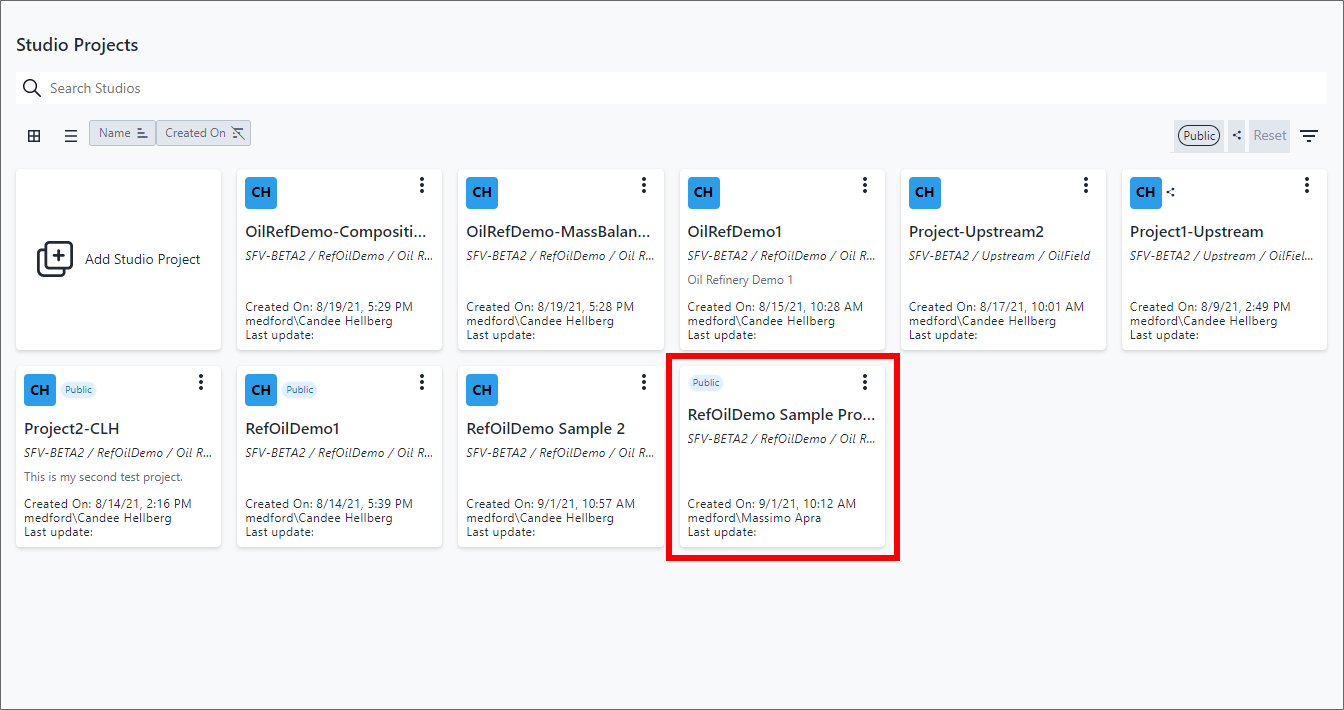
Click on the project you want to create a report for, as shown in Figure 364.
The Studio Project project name dashboard opens.
Studio Project [project name] example
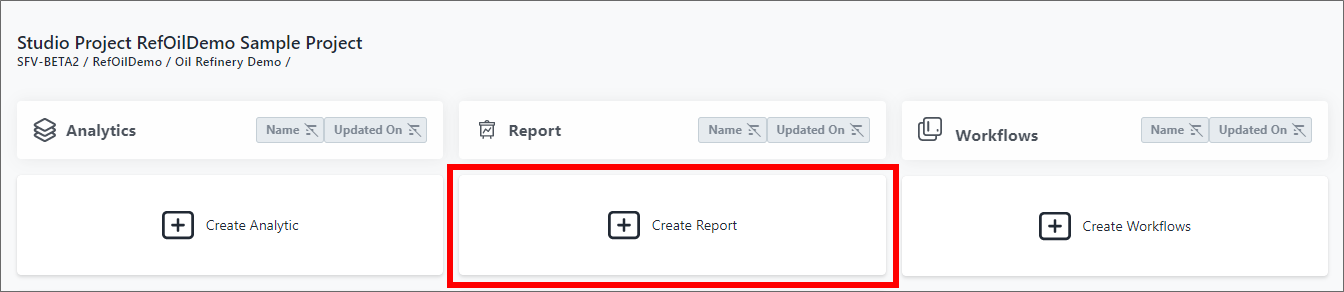
Alternatively, you can click on the Report column header to open the Report dashboard.Click on Create Report.
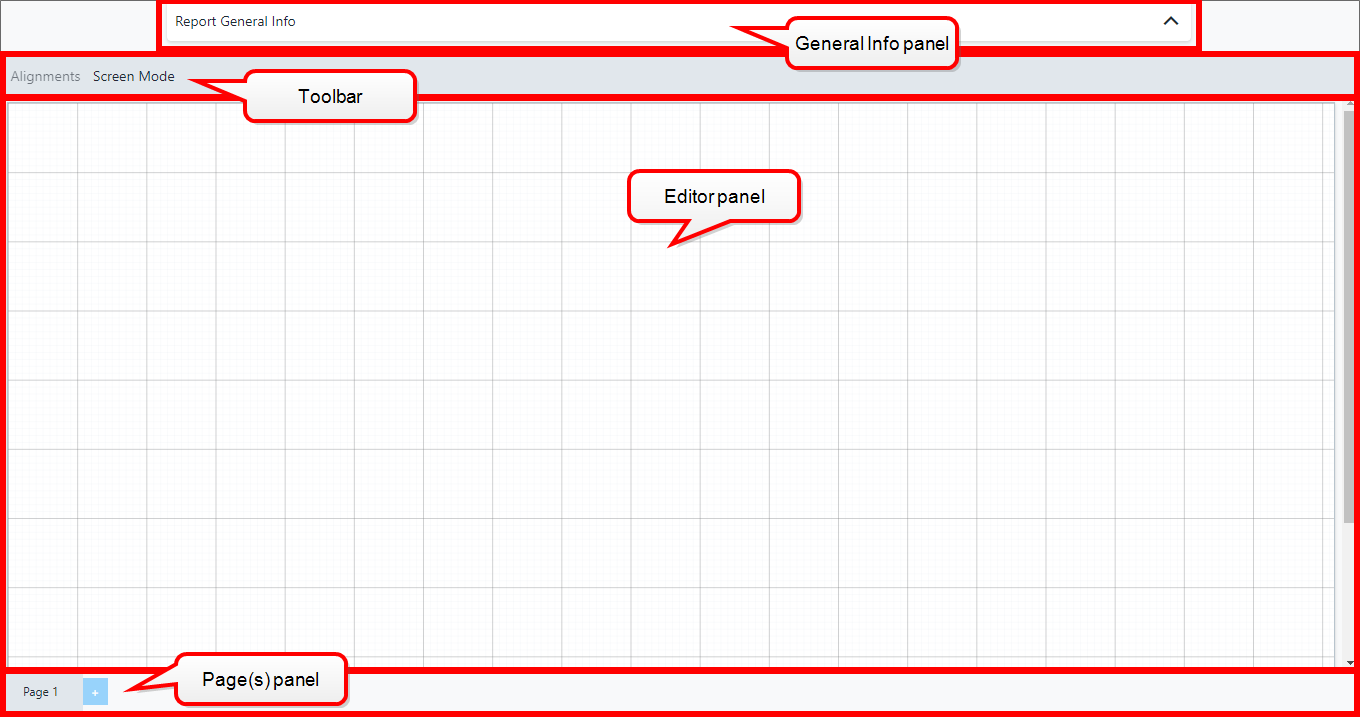
The Report Web Editor opens, displaying a General Information drop-down, a toolbar, the Report Web Editor panel and a Page(s) panel.
Report Panel
Click on Report General Info to open the Report General Info panel.
Report General Info - General panel
Report General Info - General Panel

The Report General Info panel is where you define the information and setup the layout of the report you are creating. The panel is divided into six tabs, which are described in the following table.
Tab Description General The General panel allows you to assign a name and description for the report. This name is shared with the other SFHub applications. Type The Type panel allows you to characterize the type of report. Data Sources The Data Sources panel displays a summary table of the data sources referenced by the Visuals in the report. This tab is active only if you have chosen "Element" as the Level in the 'Type' panel. Not applicable to 'Create' mode; only available in 'Edit' and 'Delete' modes. Visual The Visual Interconnection panel displays a Interconnection summary table of the interconnections configured on the Visuals in the report. This tab is active only if you have chosen "Model" as the Level in the 'Type' panel. Not applicable to 'Create' mode; only available in 'Edit' and 'Delete' modes. Interface The Interface panel displays a table listing the interfaces exposed by the SFHub Studio Analytics referenced by the Visuals in the report.
Not applicable to 'Create' mode; only availablein 'Edit' and 'Delete' modes.Style The Style panel allows you to set up the default, general aspect styles that are to be applied to all the Visuals included in the report. In the Name box (under the General tab), type a name for the report (Figure 6 shows the General tab panel).
We recommend giving your report a name that describes the report's content, as this is the name that is visible to all other SFHub applications.
(Optional) In the Description box, type in a short explanation of the report.
Click the Type tab.
The Type panel opens.
Report General Info - Type Panel
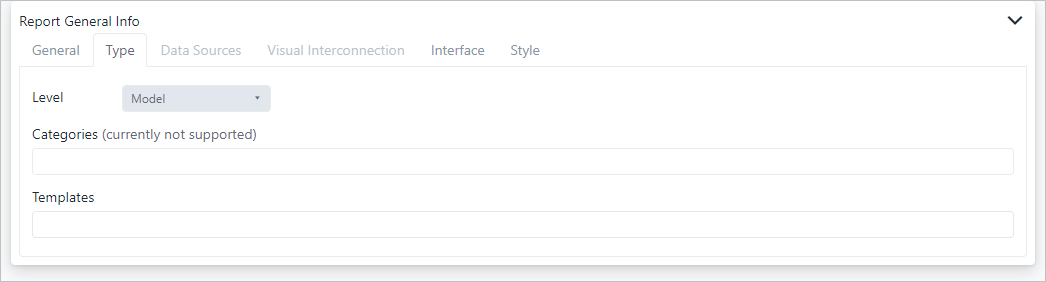
Click on Level and choose the level of the Sigmafine organization where you want the report to show. Options are the Element, Model or both levels.
Report General Info - Type - Level

(Optional) Click the Template box and choose the template in which the report is to be made available.
Report General Info - Types - Templates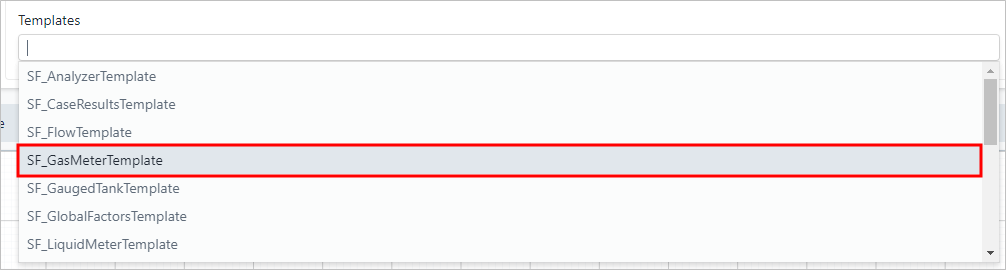
The Template is added to the box, as shown in the following figure.
Report General Info - Types - Template Chosen

(Optional) Click the Interface tab, to view a table of the interfaces exposed by the SFHub Studio Analytics referenced by the visuals in your report. If no data sources display (as shown in the following figure) it indicates that no data sources are referenced by the visuals.
Click the Style tab.
The Style panel opens.
Report General Info - Style Panel
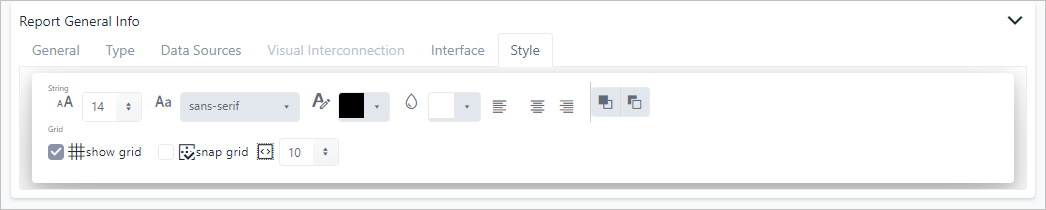
The Style panel is where you define the default styles to be applied to all the visuals you include in the report, as well as the grid layout to be the default for the report. Any options you set here are only defaults; you are still able to change any of these aspects for any visual you add to your report.
Choose the String (content) and Grid styles you want to use as your defaults.
Option Description 
The default font size to be used for the data in each visual that contains data.
You can increase or decrease the font size by typing it in the box or by using the arrows. Font sizes range from 10 to 48 pixels. While you can type in any number
The default font family to be used for the data in each visual that contains text. The fonts available in the drop-down list depend on the font families available on your computer. 
The default font color to be used for the information in each visual that contains data, a title or a name. A color selection panel opens, allowing you to choose from a set of standard colors, create you own color using color sliders, or use a HEX code to define the default color. For more details see Color Choice Panel. 
The default grid color to be used as the color of the grid background. A color selection panel opens, allowing you to choose from a set of standard colors, create you own color using color sliders, or use a HEX code to define the default color. For more details see Color Choice Panel. 
The default text alignment to be used for the data, title, name or image in each visual. Options are left, center or right alignment. 
The default layering of visuals as they are placed on the report in the Report Web Editor panel. You can set the default to place each visual on the layer directly above or below the layer on which the previous visual was placed. The dark colored block depicts the current visual being added to the report. 
Indicates by default, whether the grid lines are visible or not. A check mark indicates the grid lines are visible; when you uncheck the box, the grid lines are hidden. 
Indicates by default, whether visuals should be snapped to the grid lines or free-floating. A check mark indicates that visuals are snapped to the grid lines; when you uncheck the box, the visuals are free-floating. 
Indicates the default size (in pixels) between the grid lines. You can increase or decrease the size by typing it in the box, or by using the increase/decrease arrows. While you are able to type in any size, SFHub Studio Report only recognizes sizes between 5 and 100 pixels. You can start laying out your report now, or just save these basic settings and return to laying it out later.
(Optional) To set up your report's layout, go to the Report Web Editor sectiontopics.
Click Save to save the new report.