Table Data Source
![]()
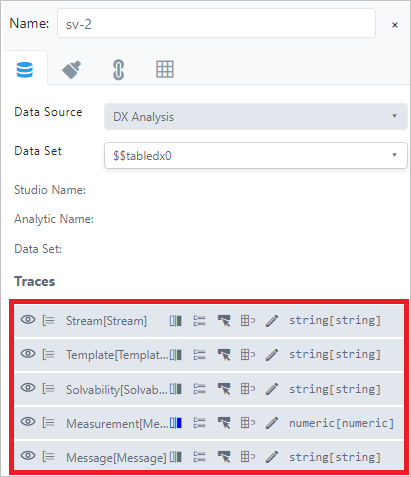
The Data Source panel allows you to configure the data source of the Table visual object. Once the Data source and Data Set have been chosen, the visual object on the report page shows a preview of the columns returned by the chosen Data Set.


The Traces section of this tab shows the list of the data columns returned by the Data Set, allowing you to configure their properties.

Traces Properties
| Icon | Description |
|---|---|
| Column Visibility When clicked, this icon allows you to hide/show the column on the table. | |
| Grouped This icon indicates the Trace's status. When Blue ( Table Group Area  | |
| Column Format When clicked, this icon allows you to format the column using a formatting toolbar that opens. Column Formatting toolbar  This toolbar lets you configure: - Font and font size - Foreground and background color - Content alignment - Precision for numeric values - Format for Date and time values You can also use this toolbar to customize the column caption. | |
| Aggregation Rules When clicked, it opens a panel in which you can configure the aggregation rules for each column. Column aggregation Rules configuration panel  The Aggregate Group drop-down lets you select the configure the aggregations rule (grouping columns are the ones you chose for grouping). The Aggregate drop-down also lets you choose the aggregation rule to be applied (sum, count, average,min and max). Note : The Aggregate drop-down is enabled only for columns having numeric values. | |
| Interconnections This icon indicates whether a column is the source column of an interconnection between two visuals. When blue ( | |
| Backwards Lookup This icon enables the localization of the element in the display, when the column content is clicked. When chosen, the icon turns blue ( | |
| Editor Settings When clicked, it opens a column for editing. This feature is not available yet; it will be available in the next release. |