Visual Toolbar
Each visual that you place on a page includes it's own toolbar. The
toolbar can be used to activate the edit configuration panel for the
visual or remove the visual from the report page. The toolbar also
includes a visual ID that is automatically assigned, but can be changed
to whatever you want to call that visual. The name is made available to
other visuals and SFHub apps for referencing that visual or its data
(data applies only to table or chart visuals).
Visual Toolbar

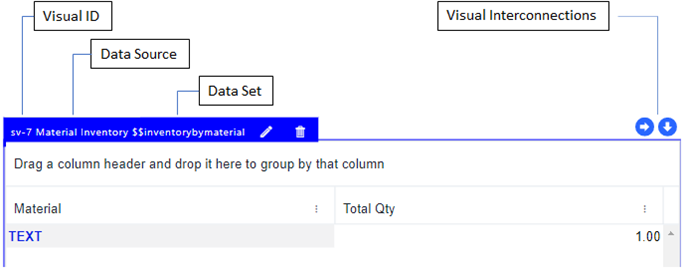
When the visual is fully configured, the toolbar shows more information,
as shown in the following figure.
Fully Configured Visual - Toolbar display
The following table describes the items found on the visual toolbar.
Report Web Editor Visual Toolbar Items
| Toolbar Item | Description |
|---|---|
| Visual ID | This item is an identifier automatically assigned by the Report Web Editor when a Visual object is added to the report. The ID can be changed through the Visual's configuration panel. |
| Data Source | This item is the name of the SFHub Analytic bound to the Visual. |
| Data Set | This item is the name of the SFHub Variable bound to the Visual. |
| Interconnections | These items indicate that the Visual has interconnections with other Visuals, as indicated by blue circle icons with arrows. When visible, it indicates that the visual is the Source visual of an interconnection with other visuals. Selecting a data in this visual will cross-filter the content of other visuals. When visible, it indicates that the visual has an interconnection configured on it. Its content is controlled/filtered by the selection made on the Source Visual. |
| Modify | The |
| Delete | The |