Meter Report Example
Following is an example report (Meter Report) that was created with Reporting Services. This report is an example on how you can visualize the data available in SQL Server using Microsoft SQL Server Reporting Services. This report is not maintained as a product from Sigmafine. This example should be used only as a reference.
Note: The following items are only general guidelines for Report rendering. Data Source, Data Set and Connections were given as a preliminary guide, as they employ the Stored Procedure created for this example. For more details on how to design a Report, please contact your Business Intelligence specialist.
Report Guidelines
The following are guidelines you can use for included the most common items to your report layout.
Matrix or Table
The most common object to have in a Report is a 'Matrix' or 'Table'.
To add a Matrix or Table:
Drag-and-drop a Matrix or Table.
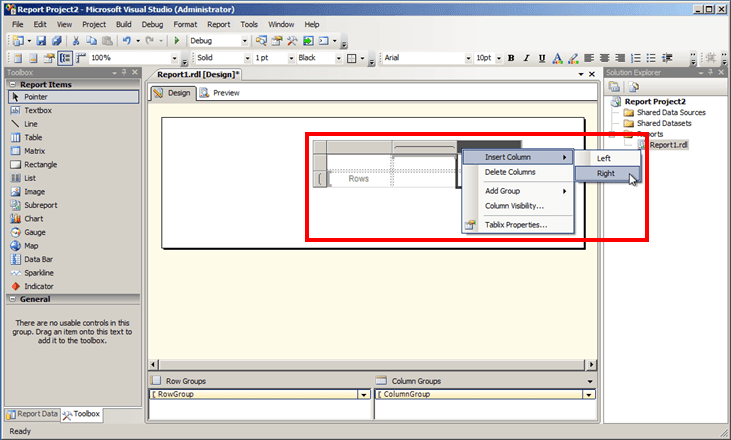
To add a column, right-click on the Matrix or Table and select Insert Column > Left or Right, depending on which side you want to add the column. 'Right' is usually selected for the first column.
Repeat step 2 for each column you need to add.
 EXAMPLE: Matrix - Insert a Column
In this example, we have added a Matrix to our report and are in the process of selecting to insert columns to the right.
Format Columns
You can add Header and Footers, and also format fonts and cells as you want.
Remember to associate each column with the type of data that exists in the dataset you have selected.
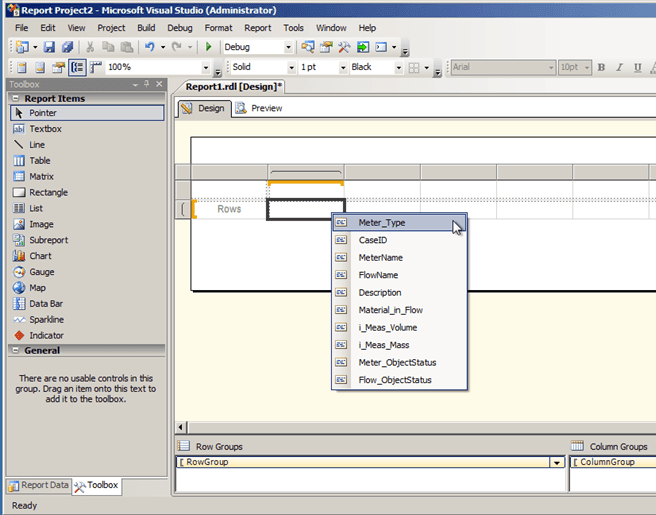
Right-click on a column row to select the type of data you want listed in that column.
Repeat this step for each column.
EXAMPLE: Selecting a data type for a columnIn this example, we want to setup our first column to display meter type, so we are selecting 'Meter_Type' from the list of data types that exist in our Dataset.
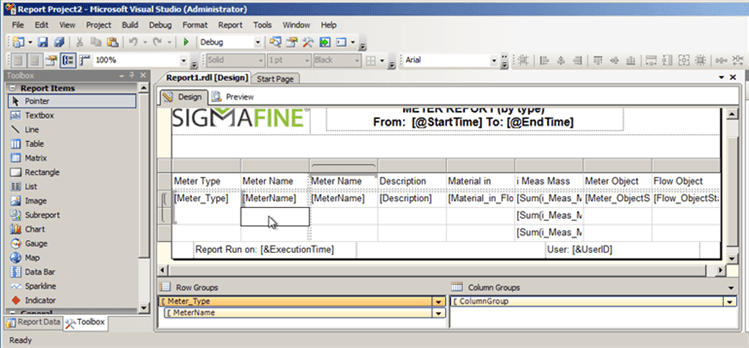
 EXAMPLE: Report layout complete
The following figure shows a completed report layout, based on the data types we have selected from those available in our dataset and all the other layout options we have selected from the Report Items pane.
Preview Your Report
When you have finished your layout it is always good practice to preview what the report is going to look like.
To preview your report:
Click on the Preview tab.
Enter the Start Time and End Time dates for the data with which you are working.
Click the View Report button.
The report displays in the Preview pane.
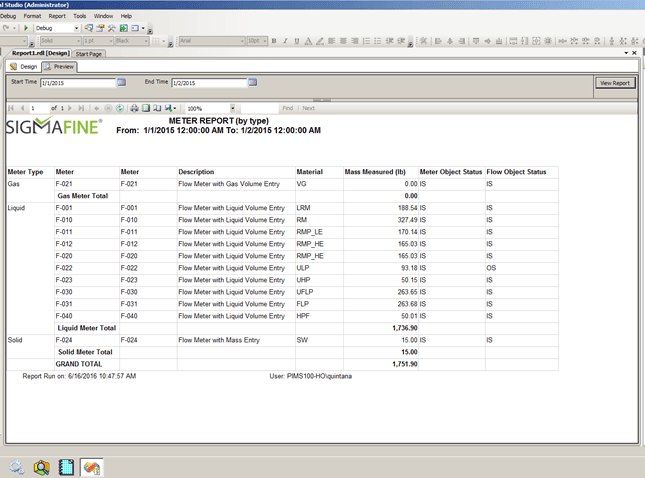
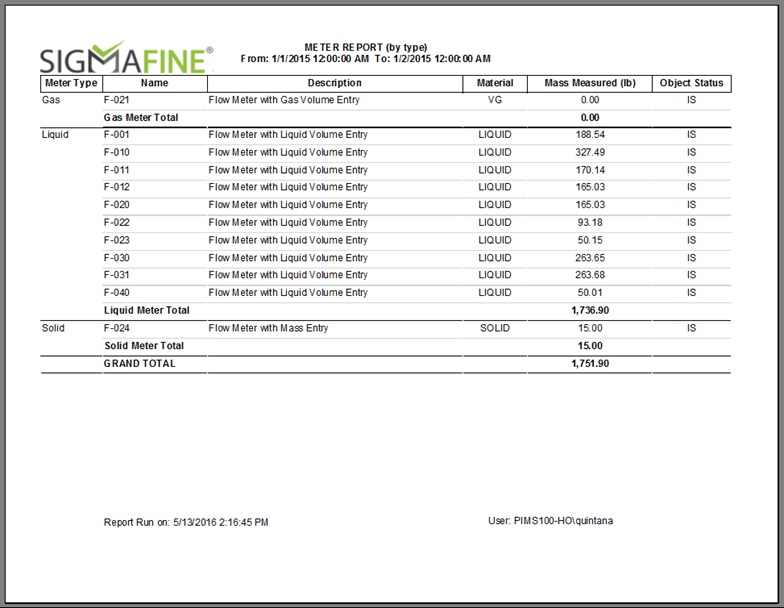
The following is an example of a completed report that includes more details as configured with more items than in our example in the preview pane.